

Question: Please show me how to read this dashboard and answer these questions. Review the visualization above - which department has the highest total residual risk
Please show me how to read this dashboard and answer these questions.
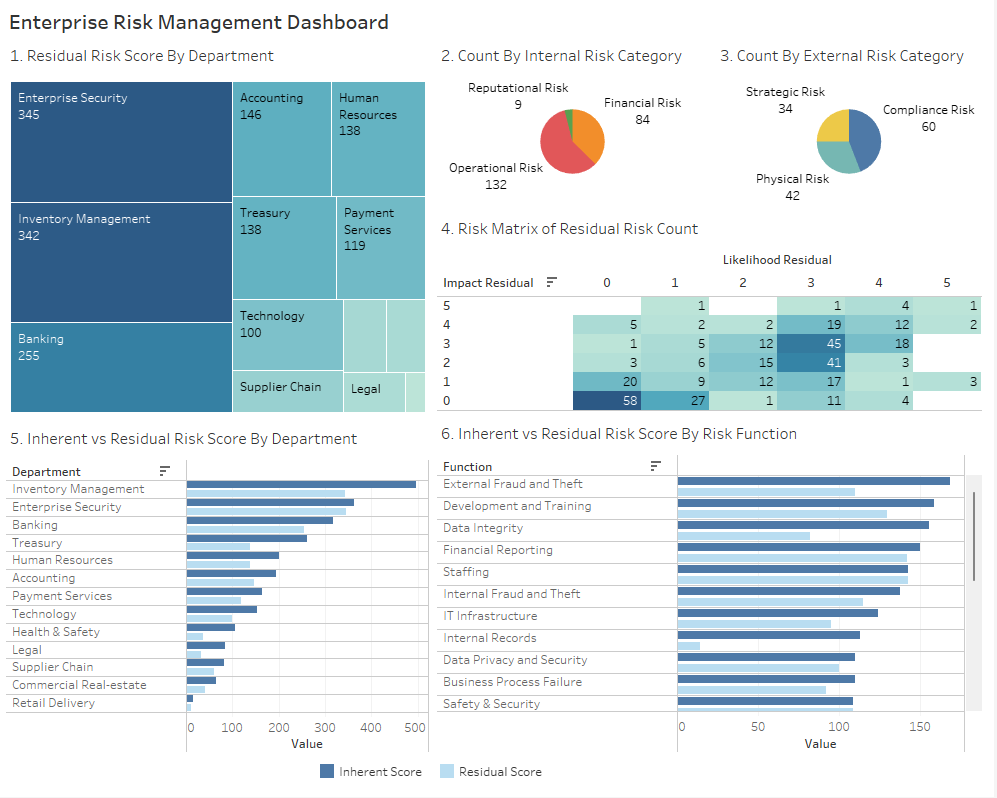
- Review the visualization above - which department has the highest total residual risk score?
2. How many internal risks were identified and included?
3. Review the visualization that depicts internal risk and external risks. Write a sentence to summarize a conclusion you may form from the pie charts.
4. Review the Risk Matrix of Residual Risk Count. What is this visualization communicating to users?
5. Review the Risk Matrix of Residual Risk Count paying special attention to the blue box with the number 58 in it what does this box mean? What is it communicating?
6. Review the Inherent vs. Residual Risk Score by Risk Function visualization what is this visualization communicating? Why might it be important to management?
7. Review the Inherent vs. Residual Risk Score by Risk Function visualization Which function has mitigated, transferred or avoided most of its identified inherent risks?
Enterprise Risk Management Dashboard 1. Residual Risk Score By Department 2. Count By Internal Risk Category 3. Count By External Risk Category 4. Risk Matrix of Residual Risk Count 5. Inherent vs Residual Risk Score By Department 6. Inherent vs Residual Risk Score By Risk Function Enterprise Risk Management Dashboard 1. Residual Risk Score By Department 2. Count By Internal Risk Category 3. Count By External Risk Category 4. Risk Matrix of Residual Risk Count 5. Inherent vs Residual Risk Score By Department 6. Inherent vs Residual Risk Score By Risk Function
Step by Step Solution
There are 3 Steps involved in it

Get step-by-step solutions from verified subject matter experts