

Question: PLEASE SHOW MICROSOFT EXCEL EQUATIONS USED FOR EACH PART! Thank you. Part 1 - Given the equation for density of water above (valid between 4C
PLEASE SHOW MICROSOFT EXCEL EQUATIONS USED FOR EACH PART! Thank you.
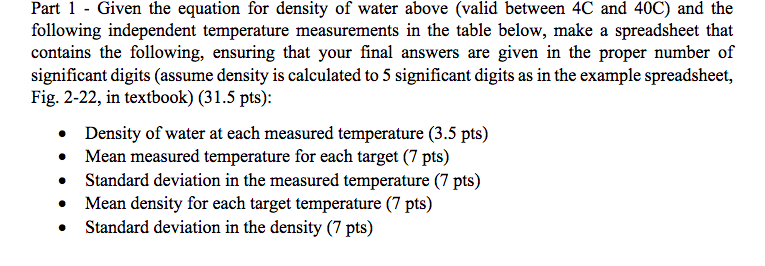
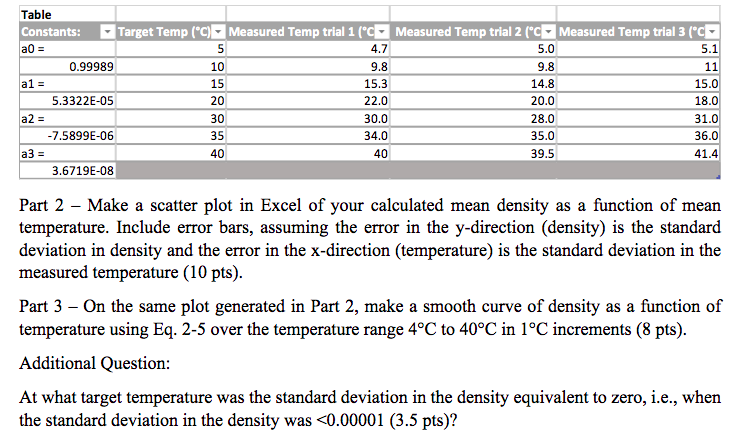
Part 1 - Given the equation for density of water above (valid between 4C and 40C) and the following independent temperature measurements in the table below, make a spreadsheet that contains the following, ensuring that your final answers are given in the proper number of significant digits (assume density is calculated to 5 significant digits as in the example spreadsheet, Fig. 2-22, in textbook) (31.5 pts): Density of water at each measured temperature (3.5 pts) Mean measured temperature for each target (7 pts) Standard deviation in the measured temperature (7 pts) Mean density for each target temperature (7 pts) Standard deviation in the density (7 pts) . Table Constants: Target Temp (C) Measured Temp trial 1 (C Measured Temp trial 2 (C Measured Temp trial 3 (C a = 5 4.7 5.0 5.1 0.99989 10 9.8 9.8 11 a1 = 15 15.3 14.8 15.0 5.3322E-05 20 22.0 20.0 18.0 a 2 = 30 30.0 28.0 31.0 -7.5899E-06 35 34.0 35.0 36.0 a3 = 40 40 39.5 41.4 3.6719E-08 Part 2 - Make a scatter plot in Excel of your calculated mean density as a function of mean temperature. Include error bars, assuming the error in the y-direction (density) is the standard deviation in density and the error in the x-direction (temperature) is the standard deviation in the measured temperature (10 pts). Part 3 - On the same plot generated in Part 2, make a smooth curve of density as a function of temperature using Eq. 2-5 over the temperature range 4C to 40C in 1C increments (8 pts). Additional Question: At what target temperature was the standard deviation in the density equivalent to zero, i.e., when the standard deviation in the density was
Step by Step Solution
There are 3 Steps involved in it

Get step-by-step solutions from verified subject matter experts