

Question: please show on excel 1. Based on the following information, calculated the expected return and standard deviation for the stock (7 points): State Probability Return
please show on excel 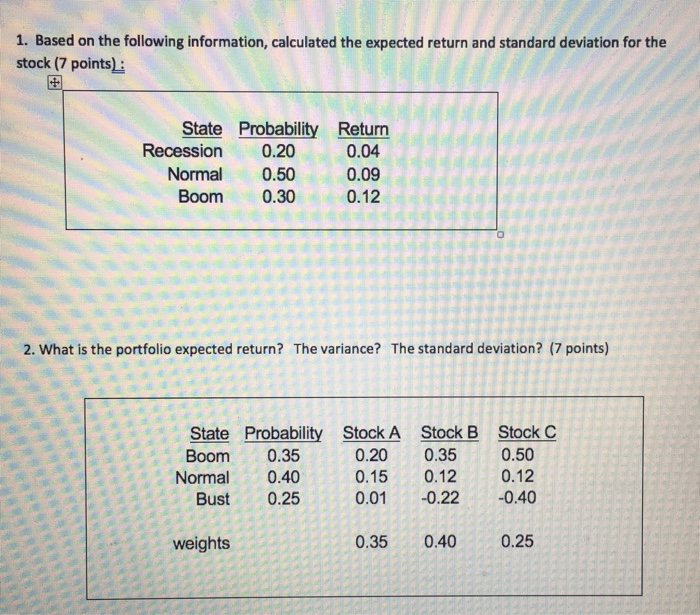
1. Based on the following information, calculated the expected return and standard deviation for the stock (7 points): State Probability Return Recession 0.20 0.04 Normal Normal 0.8 0.50 0.09 Boom 0.30 0.12 2. What is the portfolio expected return? The variance? The standard deviation? (7 points) O State Probability Boom 0.35 Normal 0.40 Bust 0.25 Stock A 0.20 0.15 .01 Stock B 0.35 0.12 -0.22 Stock C 0.50 0.12 -0.40 0 weights 0.35 0.40 0.25
Step by Step Solution
There are 3 Steps involved in it
1 Expert Approved Answer
Step: 1 Unlock

Question Has Been Solved by an Expert!
Get step-by-step solutions from verified subject matter experts
Step: 2 Unlock
Step: 3 Unlock