

Question: Please show step by step. 1. PRODUCTION COSTS The graph of a typical total cost func- tion C(x) associated with the manufacture of x units
Please show step by step.

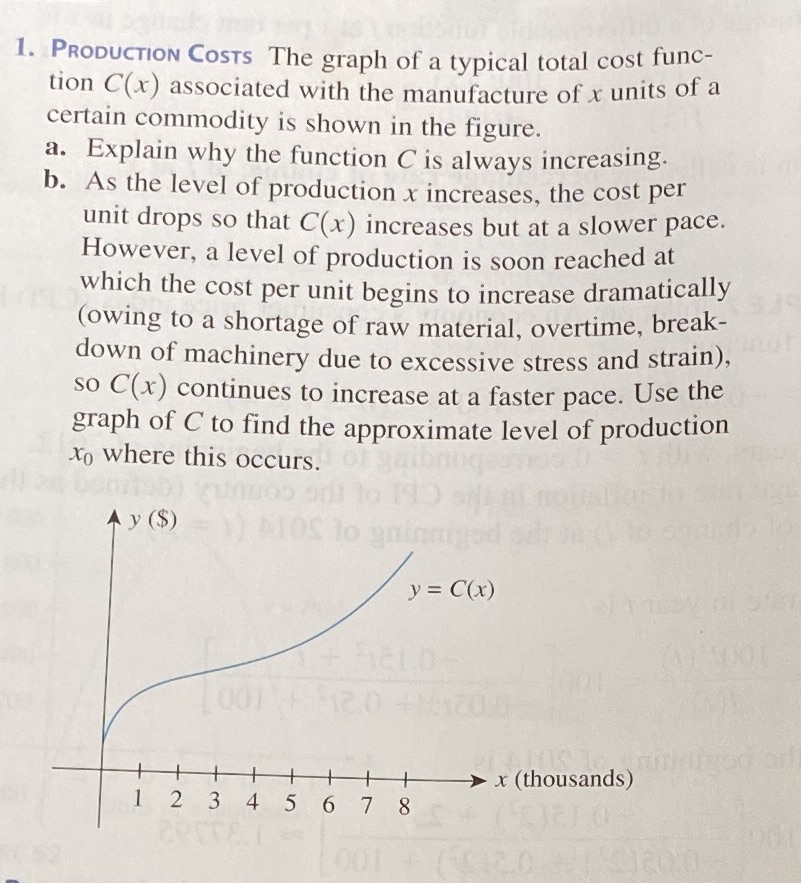
1. PRODUCTION COSTS The graph of a typical total cost func- tion C(x) associated with the manufacture of x units of a certain commodity is shown in the figure. a. Explain why the function C is always increasing. b. As the level of production x increases, the cost per unit drops so that C(x) increases but at a slower pace. However, a level of production is soon reached at which the cost per unit begins to increase dramatically (owing to a shortage of raw material, overtime, break- down of machinery due to excessive stress and strain), so C(x) continues to increase at a faster pace. Use the graph of C to find the approximate level of production to where this occurs. Ay ($) \\BIOS to animated y = C(x) x(thousands) 1 2 3 4 5 6 7 8
Step by Step Solution
There are 3 Steps involved in it

Get step-by-step solutions from verified subject matter experts