

Question: Please show step by step mathematical workings for each question and please answer it as neatly as possible. 1. The following table represents the growth
Please show step by step mathematical workings for each question and please answer it as neatly as possible.
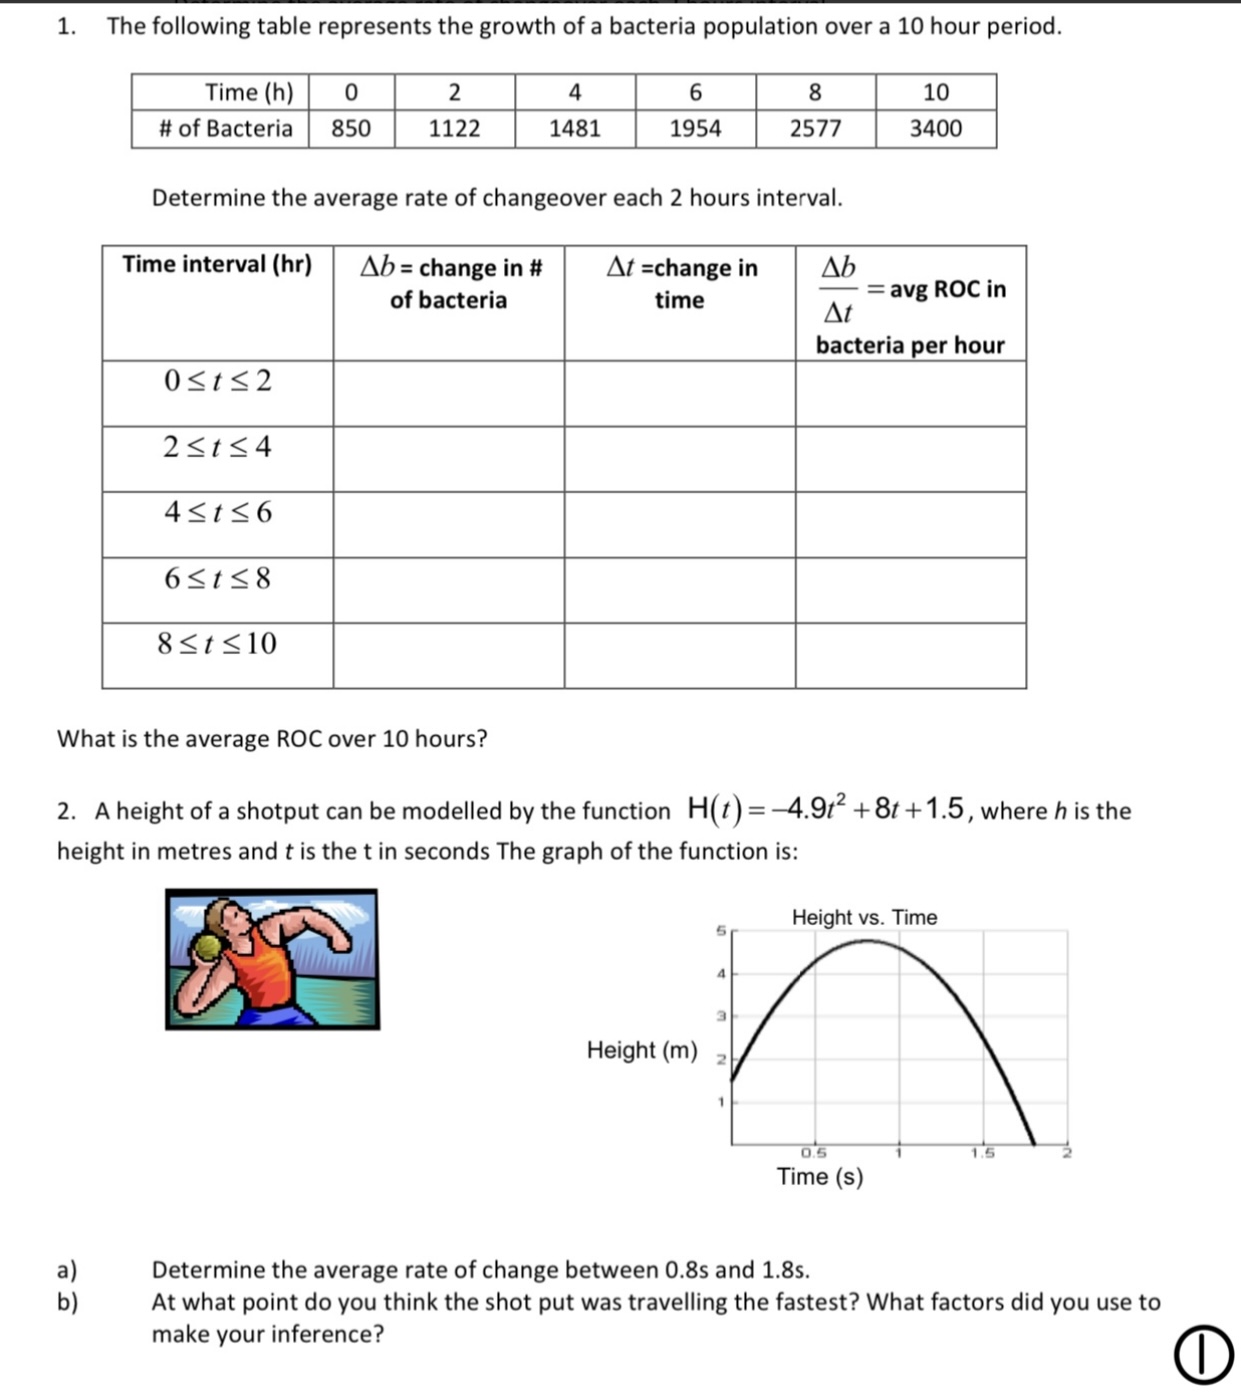
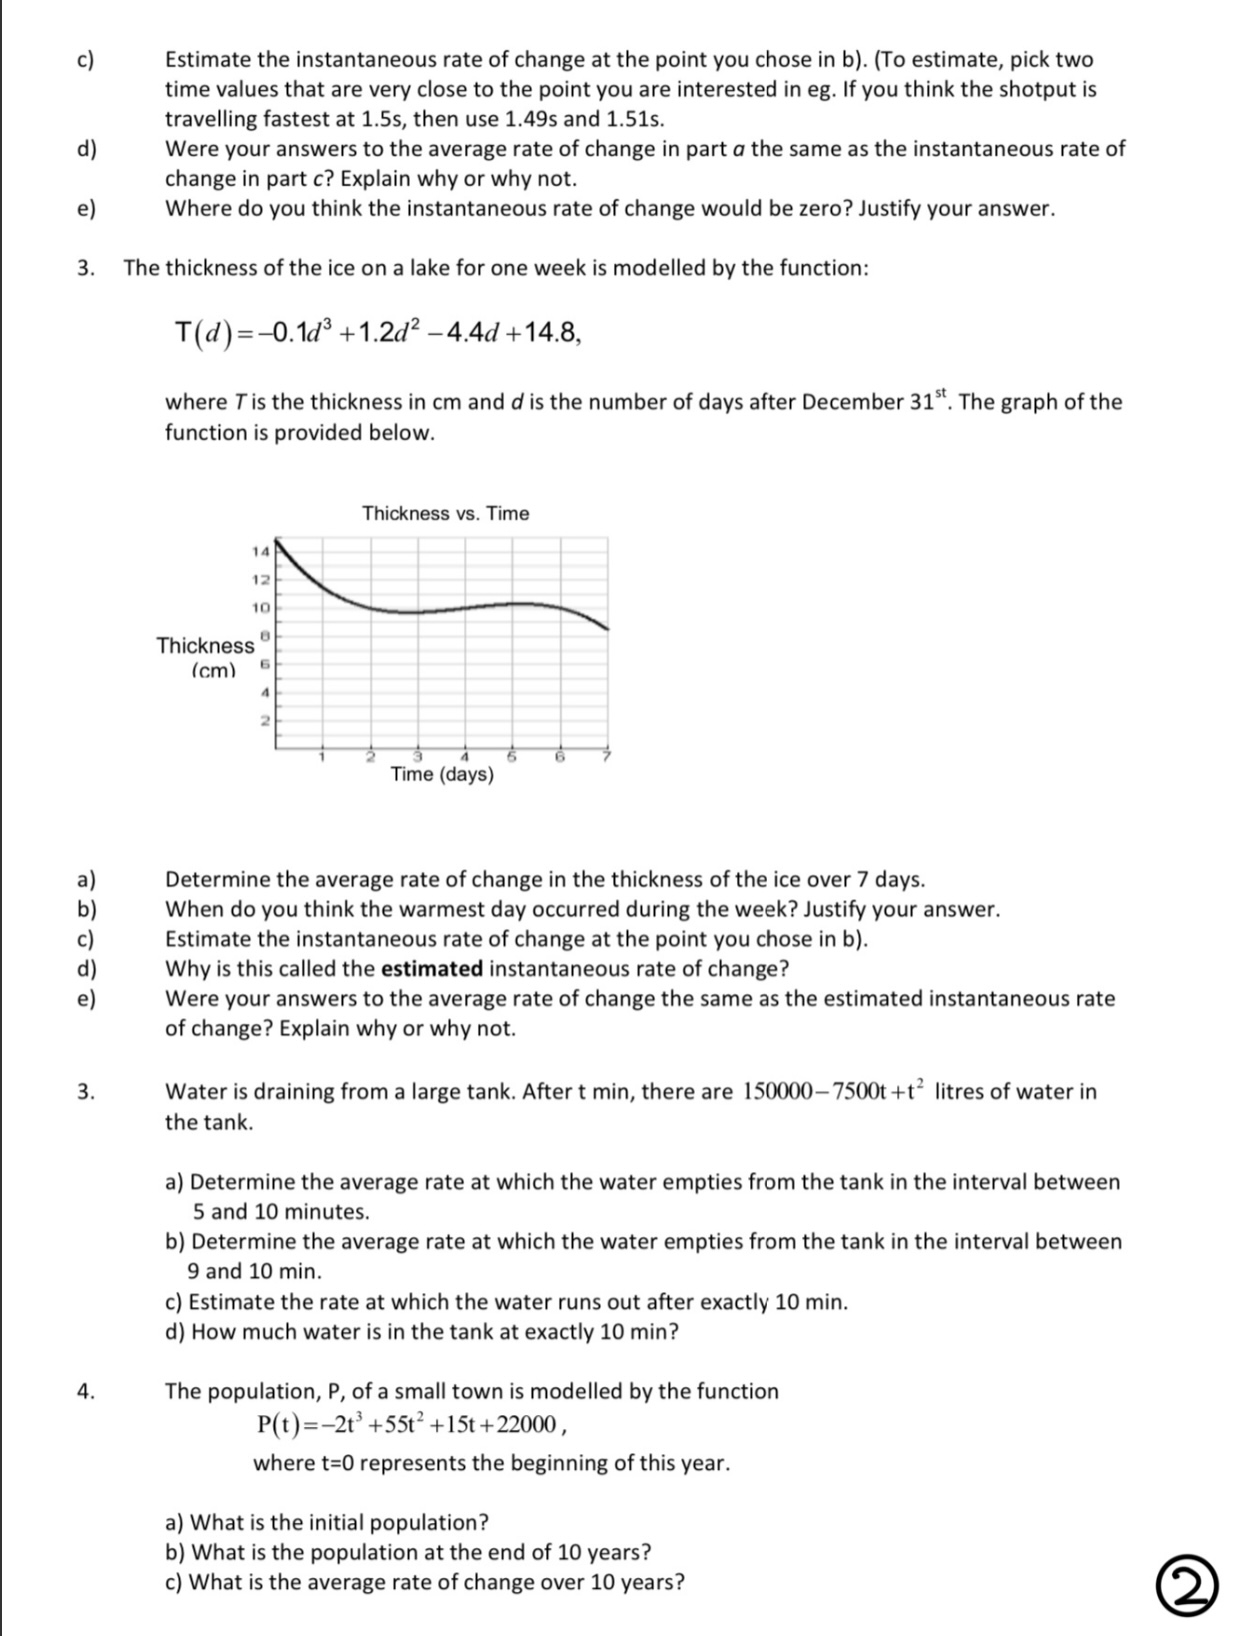
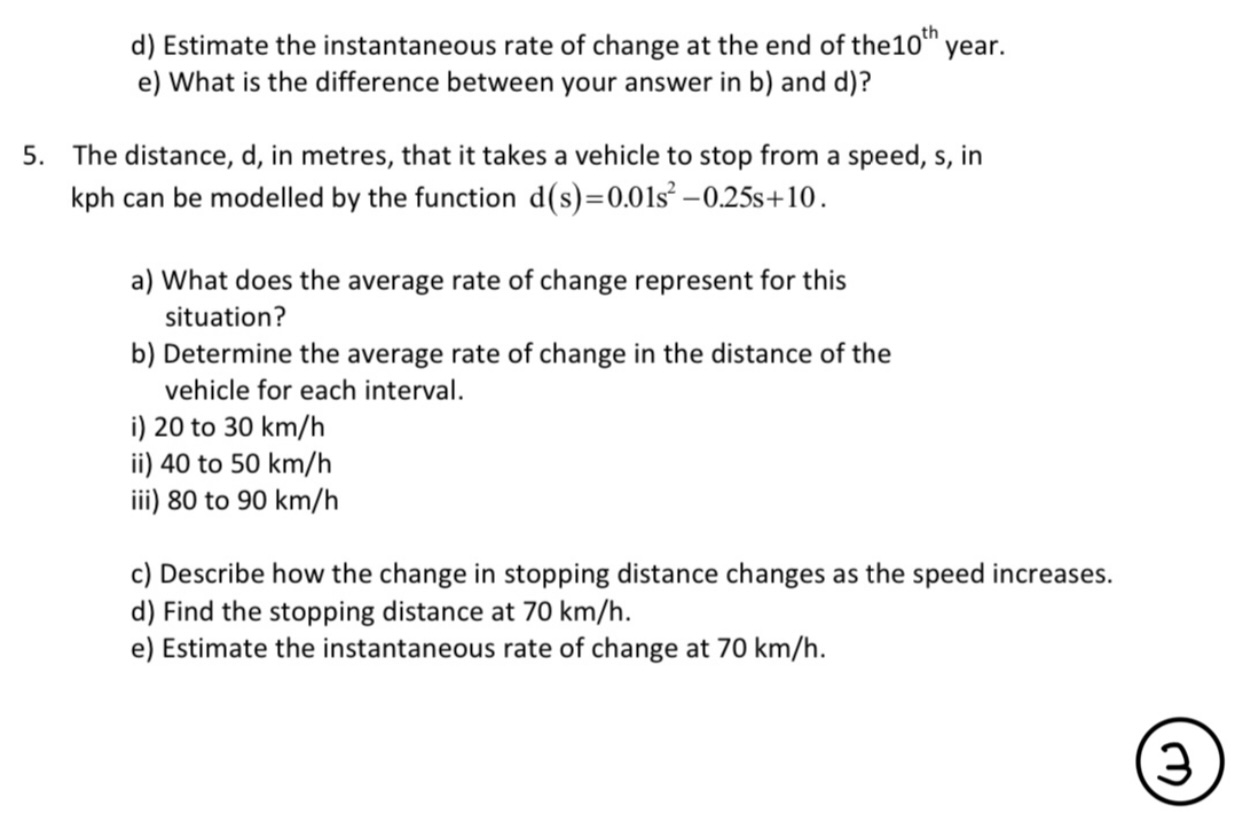
1. The following table represents the growth of a bacteria population over a 10 hour period. nI-nnun Determine the average rate of changeover each 2 hours interval. Time interval (hr) Ab = change in it A! =change in Al) of bacteria E = \"3 \"DC in bacteria per hour What is the average ROC over 10 hours? 2. A height of a shotput can be modelled by the function H(!) = 41.9!2 +3! +1.5. where h is the height in metres and t is the t in seconds The graph of the function is: Height vs. Time Height (m) 2 1 0'5 3 IIE 5 Time (s) 3) Determine the average rate of change between 0.85 and 1.85. b) At what point do you think the shot put was travelling the fastest? What factors did you use to make y0ur inference? c) Estimate the instantaneous rate of change at the point you chose in b). (To estimate, pick two time values that are very close to the point you are interested in eg. If you think the shotput is travelling fastest at 1.55, then use 1.495 and 1.515. d) Were your answers to the average rate of change in part a the same as the instantaneous rate of change in part c? Explain why or why not. e] Where do you think the instantaneous rate of change would be zero? Justify your answer. 3. The thickness ofthe ice on a lake for one week is modelled by the function: T(d)=0.1d3 +1.352 4.4d +143, where T is the thickness in cm and d is the number of days after December 31\". The graph of the function is provided below. Thickness vs. Time III I? ll") Thickness "' {cml r' 4 o n :h. V 1' 3- 'i a r'. Time (days) a] Determine the average rate of change in the thickness of the ice over 7 days. b) When do you think the warmest day occurred during the week? Justify your answer. c) Estimate the instantaneous rate of change at the point you chose in b). d) Why is this called the estimated instantaneous rate of change? e) Were your answers to the average rate of change the same as the estimated instantaneous rate of change? Explain why or why not. 3. Water is draining from a large tank. After t min, there are lSOOOOTSOOI +t: litres of water in the tank. a) Determine the average rate at which the water empties from the tank in the interval between 5 and 10 minutes. b) Determine the average rate at which the water empties from the tank in the interval between 9 and 10 min. c) Estimate the rate at which the water runs out after exactly 10 min. d) How much water is in the tank at exactly 10 min? 4. The population, P, of a small town is modelled by the function P(t)=21"+55t2 +lSl+22000, where t=0 represents the beginning of this year. a) What is the initial population? b) What is the population at the end of 10 years? c) What is the average rate of change over 10 years? d) Estimate the instantaneous rate of change at the end of thelO"I year. e) What is the difference between your answer in b) and d)? S. The distance, d, in metres, that it takes a vehicle to stop from a speed, s, in kph can be modelled by the function d(s)=0.0152 0253+ 10. a) What does the average rate of change represent for this suaon? b) Determine the average rate of change in the distance of the vehicle for each interval. i) 20 to 30 km/h ii) 40 to 50 km/h iii180 to 90 km/h c) Describe how the change in stopping distance changes as the speed increases. d) Find the stopping distance at 70 km/h. e) Estimate the instantaneous rate of change at 70 km/h. CED
Step by Step Solution
There are 3 Steps involved in it

Get step-by-step solutions from verified subject matter experts