

Question: please show step by step nputs - Costs, Capacities, Demands Demand Region Production and Transportation Cost per 1,000,000 Units Fixed Low Fixed Supply Region N.
please show step by step 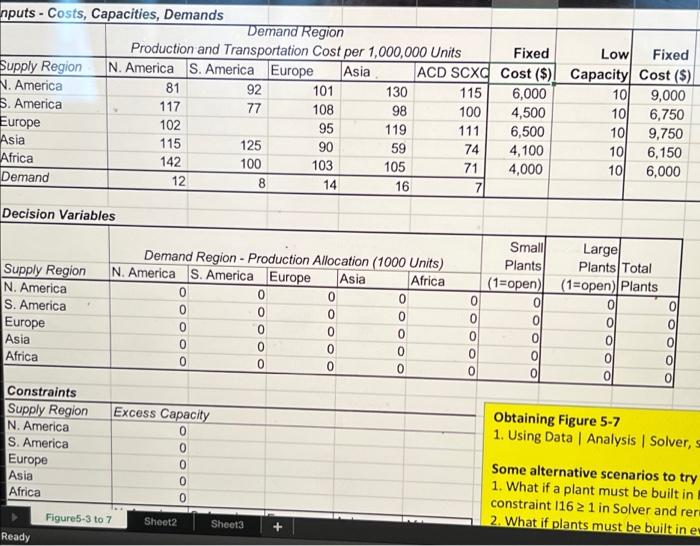
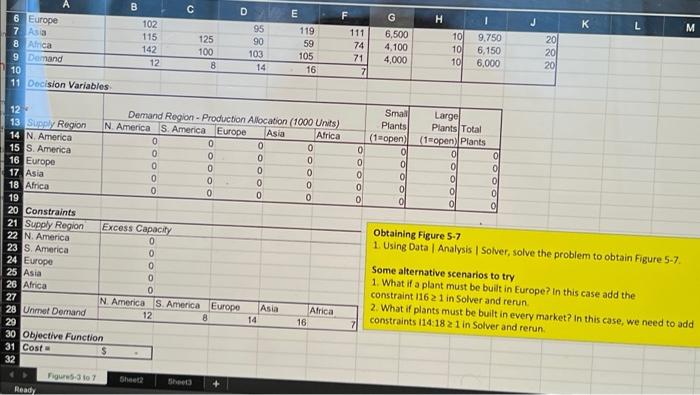
nputs - Costs, Capacities, Demands Demand Region Production and Transportation Cost per 1,000,000 Units Fixed Low Fixed Supply Region N. America S. America Europe Asia ACD SCXC Cost ($)! Capacity Cost ($) N. America 81 92 101 130 115 6,000 10 9,000 S. America 117 77 108 98 100 4,500 10 6,750 Europe 102 95 119 111 6,500 101 9,750 Asia 115 125 90 59 74 4,100 10 6,150 Africa 142 100 103 105 71 4,000 10 Demand 6,000 12 8 14 16 7 Decision Variables Supply Region N. America S. America Europe Asia Africa Demand Region - Production Allocation (1000 Units) N. America S. America Europe Asia Africa 0 0 0 0 0 0 0 0 0 0 0 0 0 0 0 0 0 0 0 0 Small Plants (1=open) 0 0 0 0 0 0 0 0 0 Large Plants Total (1=open) Plants 0 0 0 0 0 0 Constraints Supply Region N. America S. America Europe Asia Africa Obtaining Figure 5-7 1. Using Data Analysis | Solver, Excess Capacity 0 0 0 0 0 Some alternative scenarios to try 1. What if a plant must be built in constraint 116 2 1 in Solver and rer 2. What if plants must be built in e Figure5-3 to 7 Sheet2 Sheet3 + Ready B D E F G H J K L M 6 Europe 7 Asia 8 Alica 9 Demand 10 11 Decision Variables 102 115 142 12 125 100 8 95 90 103 14 E 119 59 105 16 111 74 71 7 6,500 4,100 4,000 10 101 101 1 9.750 6,150 6,000 201 20 20 Large Plants Total (1open) Plants OOOOO OOOOO OOOOO Small Plants (open) 0 0 0 0 0 OOOO 0 0 12 Demand Region - Production Allocation (1000 Units) 13 Supply Region N. America S. America Europe Asia Africa 14 N. America 15 S. America 16 Europe 17 Asia 18 Africa 19 20 Constraints 21 Supply Region Excess Capacity 22 N. America 0 23 S. America 0 24 Europe 0 25 Asia 0 26 Africa 0 27 N. America S. America Europe Asia Africa 28 Unmat Demand 12 8 14 16 29 30 Objective Function 31 Cost 32 Figur-31o7 Sheet2 Shoes Ready Obtaining Figure 5-7 1. Using Data Analysis Solver, solve the problem to obtain Figure 5-7 Some alternative scenarios to try 1. What if a plant must be built in Europe? In this case add the constraint 116 21 in Solver and rerun 2. What if plants must be built in every market in this case, we need to add constraints 114:18 21 in Solver and rerun 7
Step by Step Solution
There are 3 Steps involved in it
1 Expert Approved Answer
Step: 1 Unlock

Question Has Been Solved by an Expert!
Get step-by-step solutions from verified subject matter experts
Step: 2 Unlock
Step: 3 Unlock