

Question: Please show step by step on Excel Question 4 0 / 10 pts Expected Return Standard Deviation Portfolio P 15% 21% Market (M) 11% 18%
Please show step by step on Excel
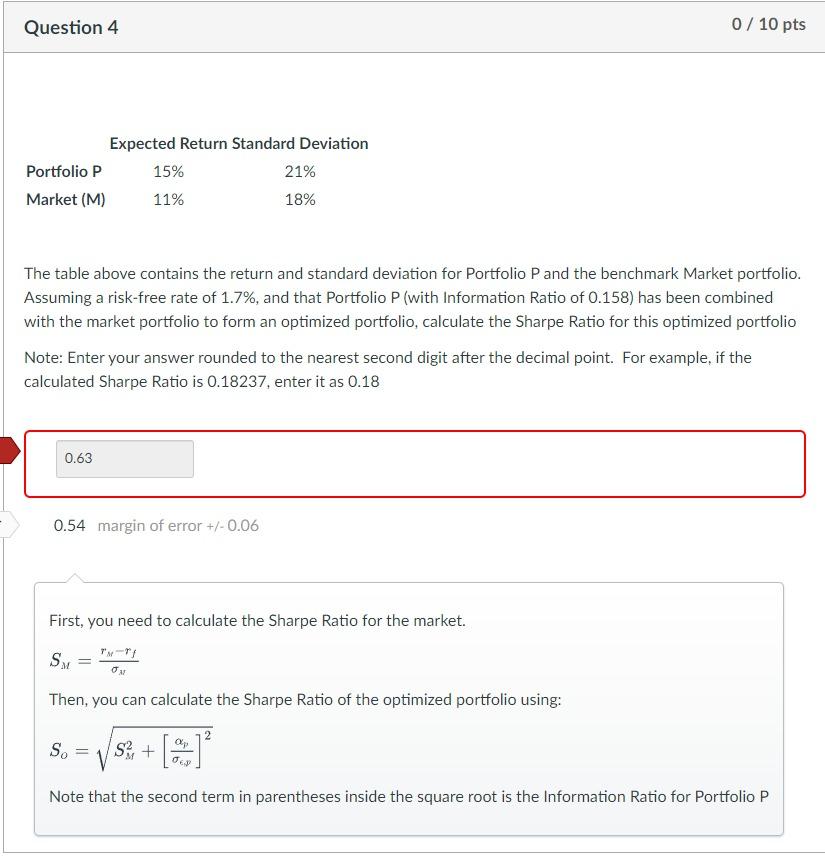
Question 4 0 / 10 pts Expected Return Standard Deviation Portfolio P 15% 21% Market (M) 11% 18% The table above contains the return and standard deviation for Portfolio P and the benchmark Market portfolio. Assuming a risk-free rate of 1.7%, and that Portfolio P(with Information Ratio of 0.158) has been combined with the market portfolio to form an optimized portfolio, calculate the Sharpe Ratio for this optimized portfolio Note: Enter your answer rounded to the nearest second digit after the decimal point. For example, if the calculated Sharpe Ratio is 0.18237, enter it as 0.18 0.63 0.54 margin of error +/- 0.06 First, you need to calculate the Sharpe Ratio for the market. S Then, you can calculate the Sharpe Ratio of the optimized portfolio using: S. s+a , op 0 Note that the second term in parentheses inside the square root is the Information Ratio for Portfolio P
Step by Step Solution
There are 3 Steps involved in it

Get step-by-step solutions from verified subject matter experts