Question: Please show step by step solutions and especially answer the interpretation part. Thank you! Boston Electric Generators has been getting many complaints from its major

Please show step by step solutions and especially answer the interpretation part. Thank you!Please show step by step solutions and especiallyPlease show step by step solutions and especially

Boston Electric Generators has been getting many complaints from its major customer, Home Station, about the quality of its shipments of home generators. Daniel Shimshak, the plant manager, is alarmed that a customer is providing him with the only information the company has on shipment quality. He decides to collect information on defective shipments through a form he has asked his drivers to complete on arrival at customers' stores. They show the following over the past 8 weeks: Even though Daniel increased his capacity by adding more workers to his normal contingent of 30, he knew that for many weeks he exceeded his regular output of 30 shipments per week. A review of his turnover over the past 8 weeks shows the following: BOO NEWS NOO TERMINATIONS 0 1 TOTAL NO. WOEKERS 30 WE . 2 > . 2 Incorrect B Incorrect Damaged Truck load Product Trucks Late -ON >4 2 O 1 1 12 3 2 31 7 3 3 32 35 36 12 23 3 3 4 4 4 2 1 1 2 2 5 20 9 30 6 3 O 3 3 12 44 6 1 See next page! 7 8 2 1 33 7 Use Excel to draw your diagram and charts. a) Develop a scatter diagram using the total number of shipments and the number of defective shipments. Does there appear to be any relationship? b) Develop a scatter diagram using the variable "turnover" (number of new hires plus number of terminations) and the number of defective shipments. Does the diagram depict a relationship between the two variables? In Excel Calculated the correlation coefficient between these two variables and interpret the resultant value to support your answer. c) Develop a Pareto chart for the type of defects that have occurred. Boston Electric Generators has been getting many complaints from its major customer, Home Station, about the quality of its shipments of home generators. Daniel Shimshak, the plant manager, is alarmed that a customer is providing him with the only information the company has on shipment quality. He decides to collect information on defective shipments through a form he has asked his drivers to complete on arrival at customers' stores. They show the following over the past 8 weeks: Even though Daniel increased his capacity by adding more workers to his normal contingent of 30, he knew that for many weeks he exceeded his regular output of 30 shipments per week. A review of his turnover over the past 8 weeks shows the following: BOO NEWS NOO TERMINATIONS 0 1 TOTAL NO. WOEKERS 30 WE . 2 > . 2 Incorrect B Incorrect Damaged Truck load Product Trucks Late -ON >4 2 O 1 1 12 3 2 31 7 3 3 32 35 36 12 23 3 3 4 4 4 2 1 1 2 2 5 20 9 30 6 3 O 3 3 12 44 6 1 See next page! 7 8 2 1 33 7 Use Excel to draw your diagram and charts. a) Develop a scatter diagram using the total number of shipments and the number of defective shipments. Does there appear to be any relationship? b) Develop a scatter diagram using the variable "turnover" (number of new hires plus number of terminations) and the number of defective shipments. Does the diagram depict a relationship between the two variables? In Excel Calculated the correlation coefficient between these two variables and interpret the resultant value to support your answer. c) Develop a Pareto chart for the type of defects that have occurred

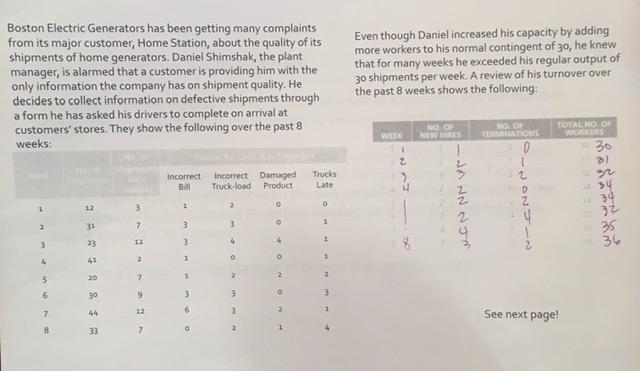
Step by Step Solution

There are 3 Steps involved in it

1 Expert Approved Answer
Step: 1 Unlock blur-text-image
Question Has Been Solved by an Expert!

Get step-by-step solutions from verified subject matter experts

Step: 2 Unlock
Step: 3 Unlock

Students Have Also Explored These Related General Management Questions!