

Question: Please show step-by-step how to solve this. Excel or by hand is okay. City government has collected the following data on annual sales tax collections
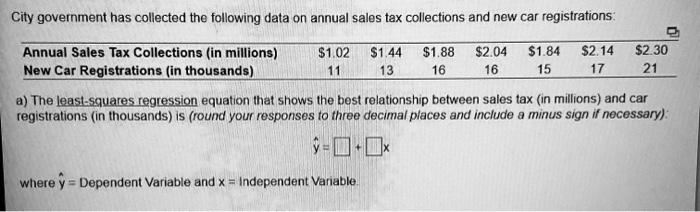
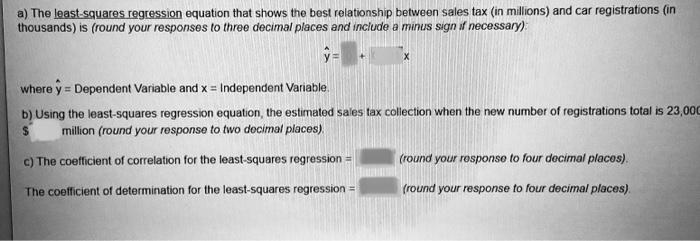
Please show step-by-step how to solve this. Excel or by hand is okay.
Step by Step Solution
There are 3 Steps involved in it
1 Expert Approved Answer
Step: 1 Unlock

Question Has Been Solved by an Expert!
Get step-by-step solutions from verified subject matter experts
Step: 2 Unlock
Step: 3 Unlock