

Question: Please show steps on Excel Blue Computers, a major server manufacturer in the United States, currently has plants in Kentucky and Pennsylvania. The Kentucky plant
Please show steps on Excel
Blue Computers, a major server manufacturer in the United States, currently has plants in Kentucky and Pennsylvania. The Kentucky plant has a capacity of 1 million units a year, and the Pennsylvania plant has a capacity of 1.5 million units a year. The firm divides the United States into five markets: northeast, southeast, midwest, south, and west. Each server sells for $1,000. The firm anticipates a 50 percent growth in demand (in each region) this year (after which demand will stabilize) and wants to build a plant with a capacity of 1.5 million units per year to accommodate the growth. Potential sites being considered are in North Carolina and California. Currently the firm pays federal, state, and local taxes on the income from each plant. Federal taxes are 20 percent of income, and all state and local taxes are 7 percent of income in each state. North Carolina has offered to reduce taxes for the next 10 years from 7 percent to 2 percent. Blue Computers would like to take the tax break into consideration when planning its network. Consider income over the next 10 years in your analysis. Assume that all costs remain unchanged over the 10 years. Use a discount factor of 0.1 for your analysis. Annual fixed costs, production and shipping costs per unit, and current regional demand (before the 50 percent growth) are shown in Table 5-12.
- If Blue Computers sets an objective of minimizing total fixed and variable costs, where should it build the new plant? How should the network be structured?
- If Blue Computers sets a n objective of maximizing after-tax profits, where should it build the new plant? How should the network be structured?
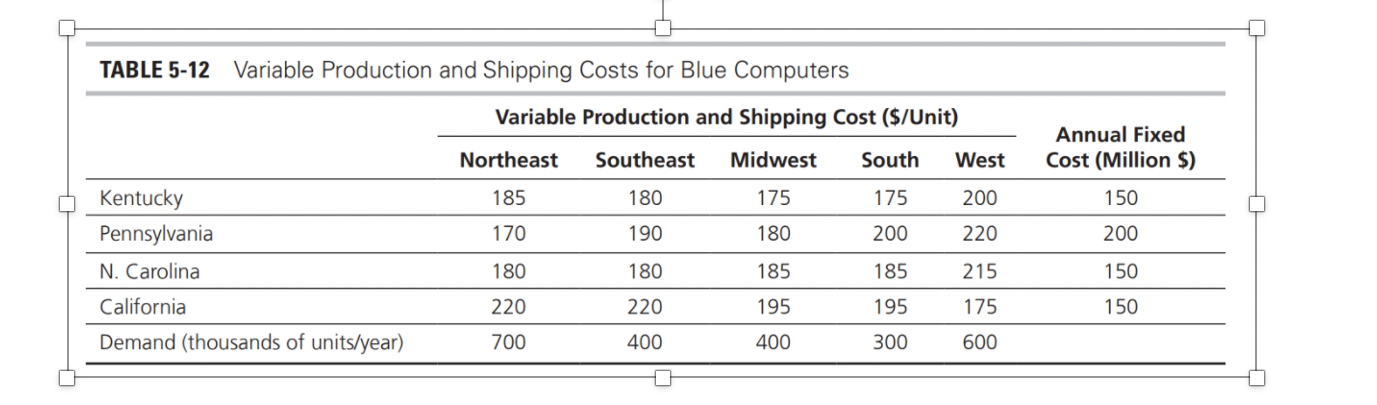
TABLE 5-12 Variable Production and Shipping Costs for Blue Computers Variable Production and Shipping Cost ($/Unit) Annual Fixed Cost (Million $) Northeast Southeast Midwest South West 185 180 175 175 200 150 170 190 180 200 220 200 Kentucky Pennsylvania N. Carolina California Demand (thousands of units/year) 180 180 185 185 215 150 220 220 195 195 175 150 700 400 400 300 600
Step by Step Solution
There are 3 Steps involved in it

Get step-by-step solutions from verified subject matter experts