

Question: please show the answer step by step because i must solve it by a financial calculator 18. You have been given the return data shown
 please show the answer step by step because i must solve it by a financial calculator
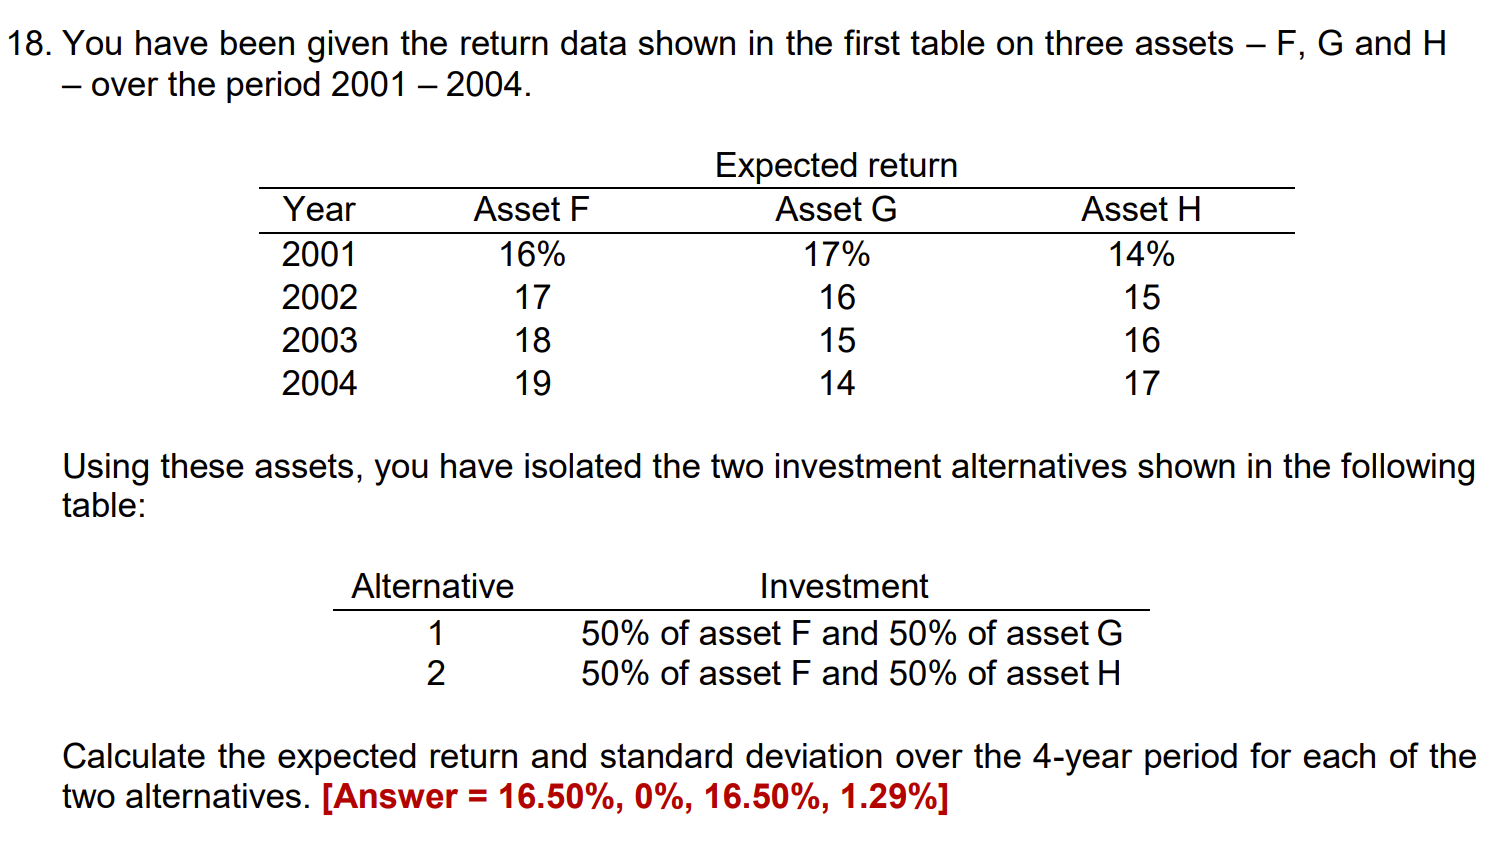
18. You have been given the return data shown in the first table on three assets F,G and H - over the period 20012004. Using these assets, you have isolated the two investment alternatives shown in the following table: Calculate the expected return and standard deviation over the 4-year period for each of the two alternatives. [Answer =16.50%,0%,16.50%,1.29% ] 18. You have been given the return data shown in the first table on three assets F,G and H - over the period 20012004. Using these assets, you have isolated the two investment alternatives shown in the following table: Calculate the expected return and standard deviation over the 4-year period for each of the two alternatives. [Answer =16.50%,0%,16.50%,1.29% ]
Step by Step Solution
There are 3 Steps involved in it

Get step-by-step solutions from verified subject matter experts