

Question: Please show the excel formulas. Problem 1 Use the Bonus assignment excel file on Blackboard. The file contains annual prices and dividends for Apple (AAPL)
 Please show the excel formulas.
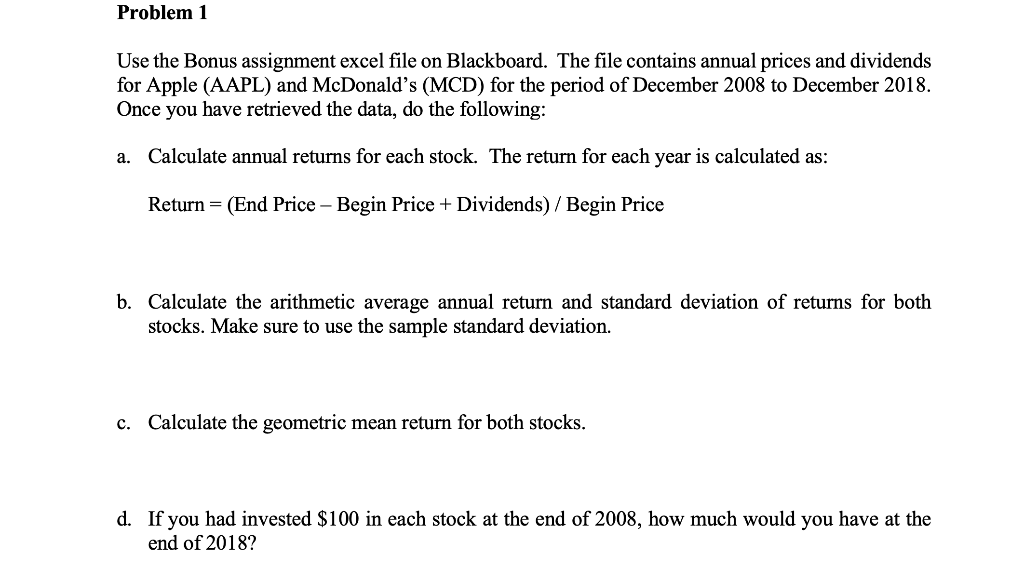
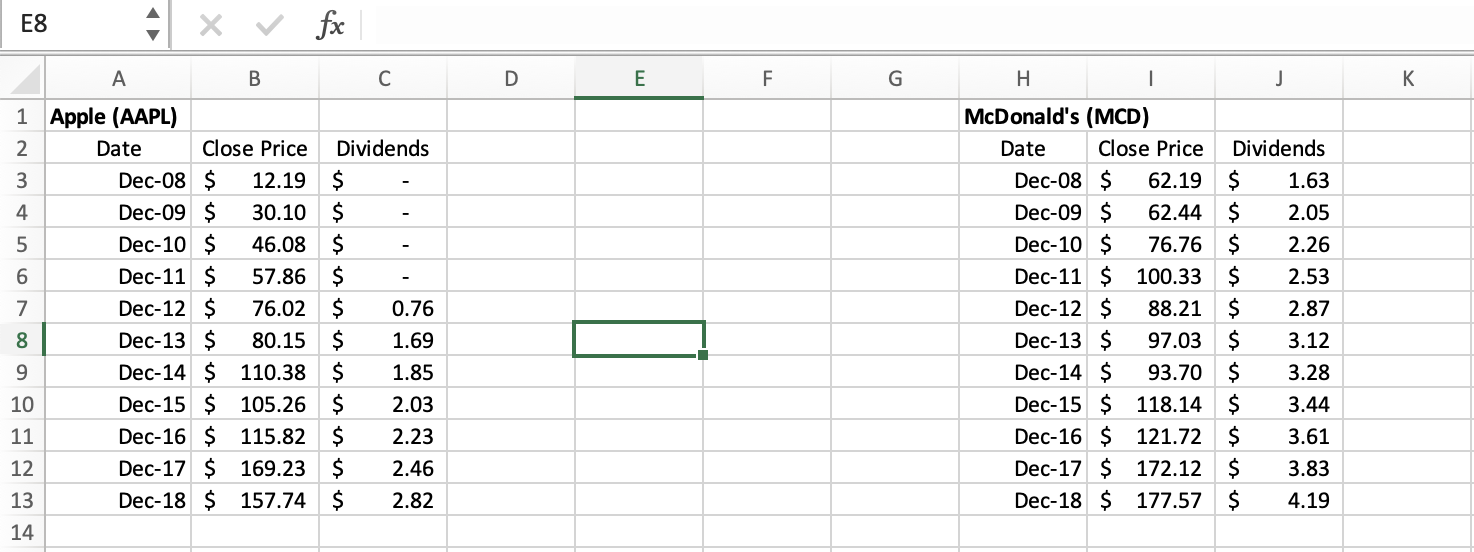
Problem 1 Use the Bonus assignment excel file on Blackboard. The file contains annual prices and dividends for Apple (AAPL) and McDonald's (MCD) for the period of December 2008 to December 2018. Once you have retrieved the data, do the following: a. Calculate annual returns for each stock. The return for each year is calculated as: Return = (End Price Begin Price + Dividends) / Begin Price b. Calculate the arithmetic average annual return and standard deviation of returns for both stocks. Make sure to use the sample standard deviation. c. Calculate the geometric mean return for both stocks. d. If you had invested $100 in each stock at the end of 2008, how much would you have at the end of 2018? E8 Xv fx A B C 1 Apple (AAPL) 2 Date Close Price Dividends Dec-08 $ 12.19 $ - Dec-09 $ 30.10 $ Dec-10 $ 46.08 $ Dec-11 $ 57.86 $ Dec-12 $ 76.02 $ 0.76 Dec-13 $ 80.15 $ 1.69 Dec-14 $ 110.38 $ 1.85 Dec-15 $ 105.26 $ 2.03 Dec-16 $ 115.82 $ 2.23 Dec-17 $ 169.23 $ 2.46 Dec-18 $ 157.74 $ 2.82 3 4 5 6 7 8 9 10 11 12 13 14 | D E F G H I J McDonald's (MCD) Date Close Price Dividends Dec-08 $ 62.19 $ 1.63 Dec-09 $ 62.44 $ 2.05 Dec-10 $ 76.76 $ 2.26 Dec-11 $ 100.33 $ 2.53 Dec-12 $ 88.21 $ 2.87 Dec-13 $ 97.03 $ 3.12 Dec-14 $ 93.70 $ 3.28 Dec-15 $ 118.14 $ 3.44 Dec-16 $ 121.72 $ 3.61 Dec-17 $ 172.12 $ 3.83 Dec-18 $ 177.57 $ 4.19 K
Step by Step Solution
There are 3 Steps involved in it

Get step-by-step solutions from verified subject matter experts