

Question: Please show the work :) ** ull 20% 8:44 pm The 2017 financial statements for Armstrong and Blair companies are summarized below: Armstrong Biar Company
Please show the work :)
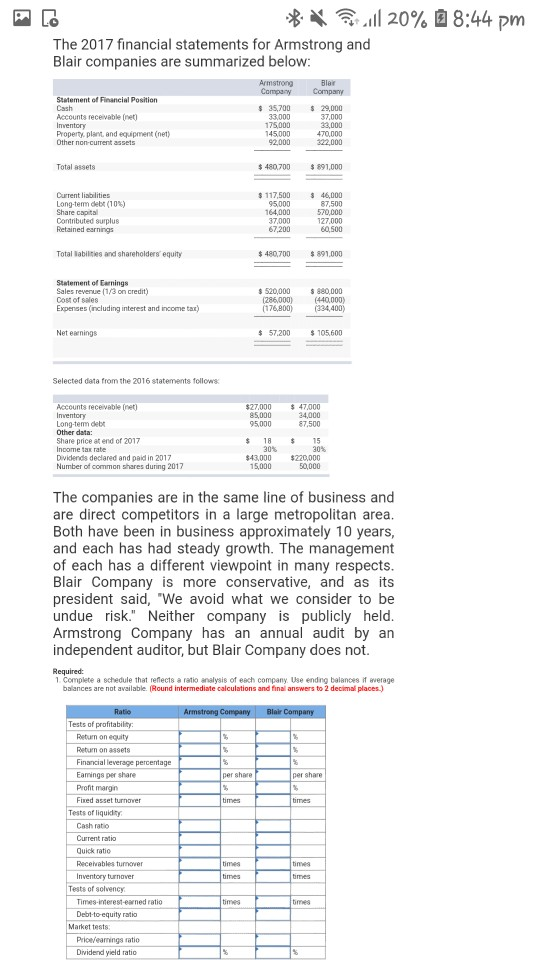
** ull 20% 8:44 pm The 2017 financial statements for Armstrong and Blair companies are summarized below: Armstrong Biar Company Statement of Financial Position $29.000 Accounts receivable net 37.000 $ 35,700 33000 175.000 145.000 33.000 Property, plant, and equipment (net) Other non-current assets Total assets $ 480.700 $ 891,000 $ 46,000 $117.500 95000 Current liabilities Long-term deb (10%) Share capital Contributed surplus Retained earnings 570.000 127.000 60.500 67.200 Total abilities and shareholders equity $ 480,700 $ 891000 Statement of Earnings Sales revenue (1/3 on credit) Cast of sales Expenses (including interest and income taxe) $ 520,000 1286.000) (176.000) $ 980.000 (440,000) (334,400) Netewnings $ 57,200 $ 105600 Selected data from the 2016 statements follows Accounts receivable (net) $27,000 85.000 95.000 $47.000 34.000 87.500 $ 18 15 Long-term del Other data: Share price at end of 2017 Income tax rate Dividends declared and paid in 2017 Number of common shares during 2017 30% $43,000 15,000 $220.000 50,000 The companies are in the same line of business and are direct competitors in a large metropolitan area. Both have been in business approximately 10 years, and each has had steady growth. The management of each has a different viewpoint in many respects. Blair Company is more conservative, and as its president said, "We avoid what we consider to be undue risk." Neither company is publicly held. Armstrong Company has an annual audit by an independent auditor, but Blair Company does not. Required: 1 Complete a schedule that reflects a ratio analysis of each company. Use ending balances it everage balances are not available. (Round intermediate calculations and final answers to 2 decimal places.) Armstrong Company Blair Company Ratio Tests of profitability Return on equity Return on assets Financial leverage percentage Famings per share Pront margin Fixed asset turnover Tests of liquidity Cash ratio Current ratio Quick ratio Receivables turnover Inventory turnover Tests of solvency Times-interest-earned ratio Debt-to-equity ratio Market tests Prica/earnings ratio Dividend yield ratio times times times
Step by Step Solution
There are 3 Steps involved in it

Get step-by-step solutions from verified subject matter experts