

Question: Data Table X 2018 2017 2016 Sales. Net income... Total, current assets, ending Property, plant and equipment, ending Total assets, ending. $ 1,496,000 $ 1,254,000
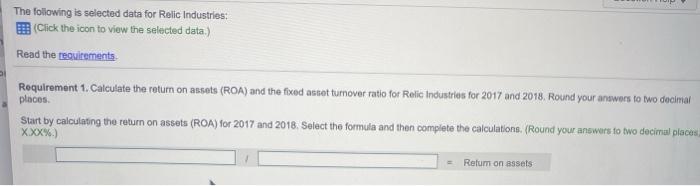
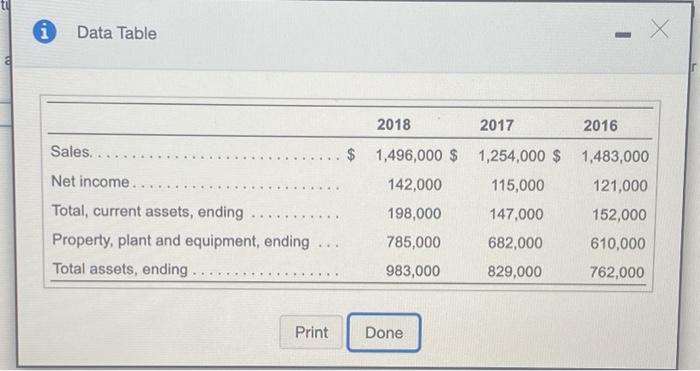
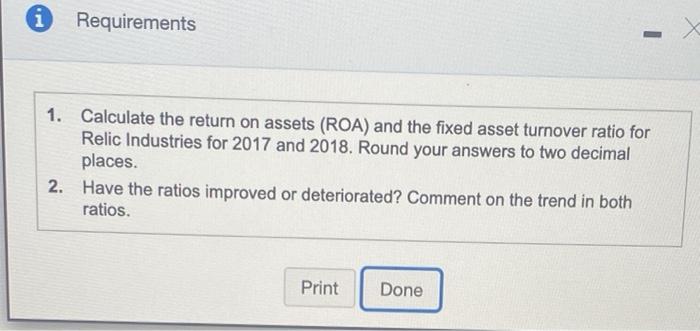
Data Table X 2018 2017 2016 Sales. Net income... Total, current assets, ending Property, plant and equipment, ending Total assets, ending. $ 1,496,000 $ 1,254,000 $ 1,483,000 142,000 115,000 121,000 198,000 147.000 152,000 785,000 682,000 610,000 983,000 829,000 762,000 Print Done i Requirements 1. Calculate the return on assets (ROA) and the fixed asset turnover ratio for Relic Industries for 2017 and 2018. Round your answers to two decimal places. 2. Have the ratios improved or deteriorated? Comment on the trend in both ratios. Print Done
Step by Step Solution
There are 3 Steps involved in it
1 Expert Approved Answer
Step: 1 Unlock

Question Has Been Solved by an Expert!
Get step-by-step solutions from verified subject matter experts
Step: 2 Unlock
Step: 3 Unlock