

Question: Refer to Table S6.1-Factors for Computing Control Chart Limits (3 sigma) for this problem. Twelve samples, each containing five parts, were taken from a process
Refer to Table S6.1-Factors for Computing Control Chart Limits (3 sigma) for this problem. Twelve samples, each containing five parts, were taken from a process that produces steel rods at Emmanual Kodzi's factory. The length of each rod in the and sample means and ranges were computed. The results were: Sample 1 23456 Sample Mean (in.) 12.404 12.400 12.393 12.406 12.399 12.399 = For the given data, the x = 12.4012 inches (round your response to four decimal places). Based on the sampling done, the control limits for 3-sigma x chart are: Upper Control Limit (UCL) - inches (round your response to four decimal places). = [ Range (in.) Sample Sample Mean (in.) Range (in.) 7 0.033 0.041 0.034 0.051 0.031 0.036 89 10 11 12 12.403 12.405 12.393 12.403 12.403 12.406 0.041 0.034 0.027 0.029 0.039 0.047
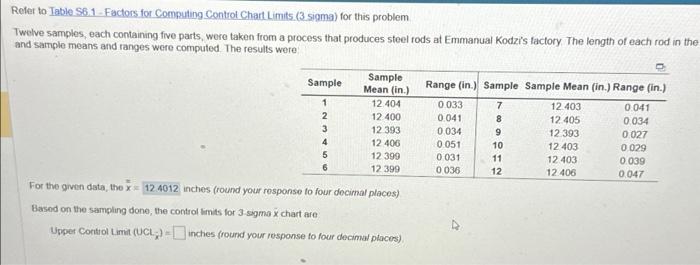
Reler to Table S6.1- Factors for Computing Controt Chart Limits. (3 sigma) for this problem Twelve samples, each containing five parts, wore taken from a process that produces steel rods at Emmanual Kodz's factory The length of each rod in the and sample means and ranges were computed The results were For the given data, the x= inches (round your response to four decimal places) Based on the sampting done, the control limits for 3 -sigmo x chart are Upper Control Limi(UCLx)= inches (round your response to four decimal placess)
Step by Step Solution
There are 3 Steps involved in it
1 Expert Approved Answer
Step: 1 Unlock

Question Has Been Solved by an Expert!
Get step-by-step solutions from verified subject matter experts
Step: 2 Unlock
Step: 3 Unlock