

Question: Please show work 1. (75 points) Using Excel, do a simulation by hand given the following information. We have system that has a single server
Please show work 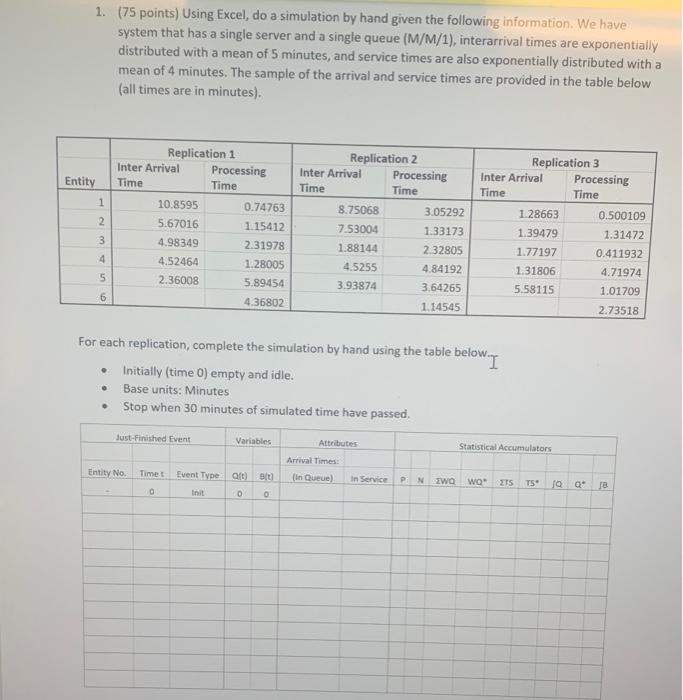
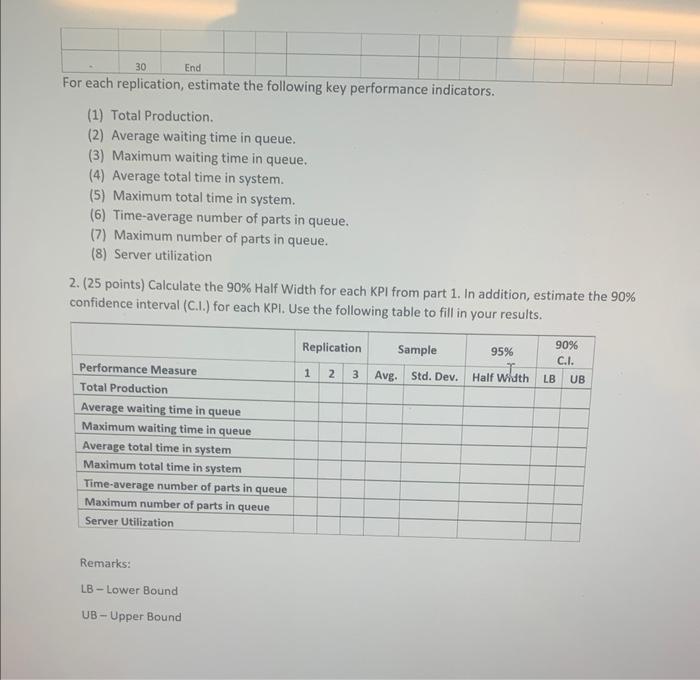
1. (75 points) Using Excel, do a simulation by hand given the following information. We have system that has a single server and a single queue (M/M/1), interarrival times are exponentially distributed with a mean of 5 minutes, and service times are also exponentially distributed with a mean of 4 minutes. The sample of the arrival and service times are provided in the table below (all times are in minutes). For each replication, complete the simulation by hand using the table below. I - Initially (time 0) empty and idle. - Base units: Minutes - Stop when 30 minutes of simulated time have passed. For each replication, estimate the following key performance indicators. (1) Total Production. (2) Average waiting time in queue. (3) Maximum waiting time in queue. (4) Average total time in system. (5) Maximum total time in system. (6) Time-average number of parts in queue. (7) Maximum number of parts in queue. (8) Server utilization 2. (25 points) Calculate the 90% Half Width for each KPI from part 1. In addition, estimate the 90% confidence interval (C.I.) for each KPI. Use the following table to fill in your results. 1. (75 points) Using Excel, do a simulation by hand given the following information. We have system that has a single server and a single queue (M/M/1), interarrival times are exponentially distributed with a mean of 5 minutes, and service times are also exponentially distributed with a mean of 4 minutes. The sample of the arrival and service times are provided in the table below (all times are in minutes). For each replication, complete the simulation by hand using the table below. I - Initially (time 0) empty and idle. - Base units: Minutes - Stop when 30 minutes of simulated time have passed. For each replication, estimate the following key performance indicators. (1) Total Production. (2) Average waiting time in queue. (3) Maximum waiting time in queue. (4) Average total time in system. (5) Maximum total time in system. (6) Time-average number of parts in queue. (7) Maximum number of parts in queue. (8) Server utilization 2. (25 points) Calculate the 90% Half Width for each KPI from part 1. In addition, estimate the 90% confidence interval (C.I.) for each KPI. Use the following table to fill in your results Step by Step Solution
There are 3 Steps involved in it
1 Expert Approved Answer
Step: 1 Unlock

Question Has Been Solved by an Expert!
Get step-by-step solutions from verified subject matter experts
Step: 2 Unlock
Step: 3 Unlock