

Question: Please show work. 2. Data collected on the yearly registrations for a Six Sigma seminar at the Quality College are shown in the following table:
Please show work.
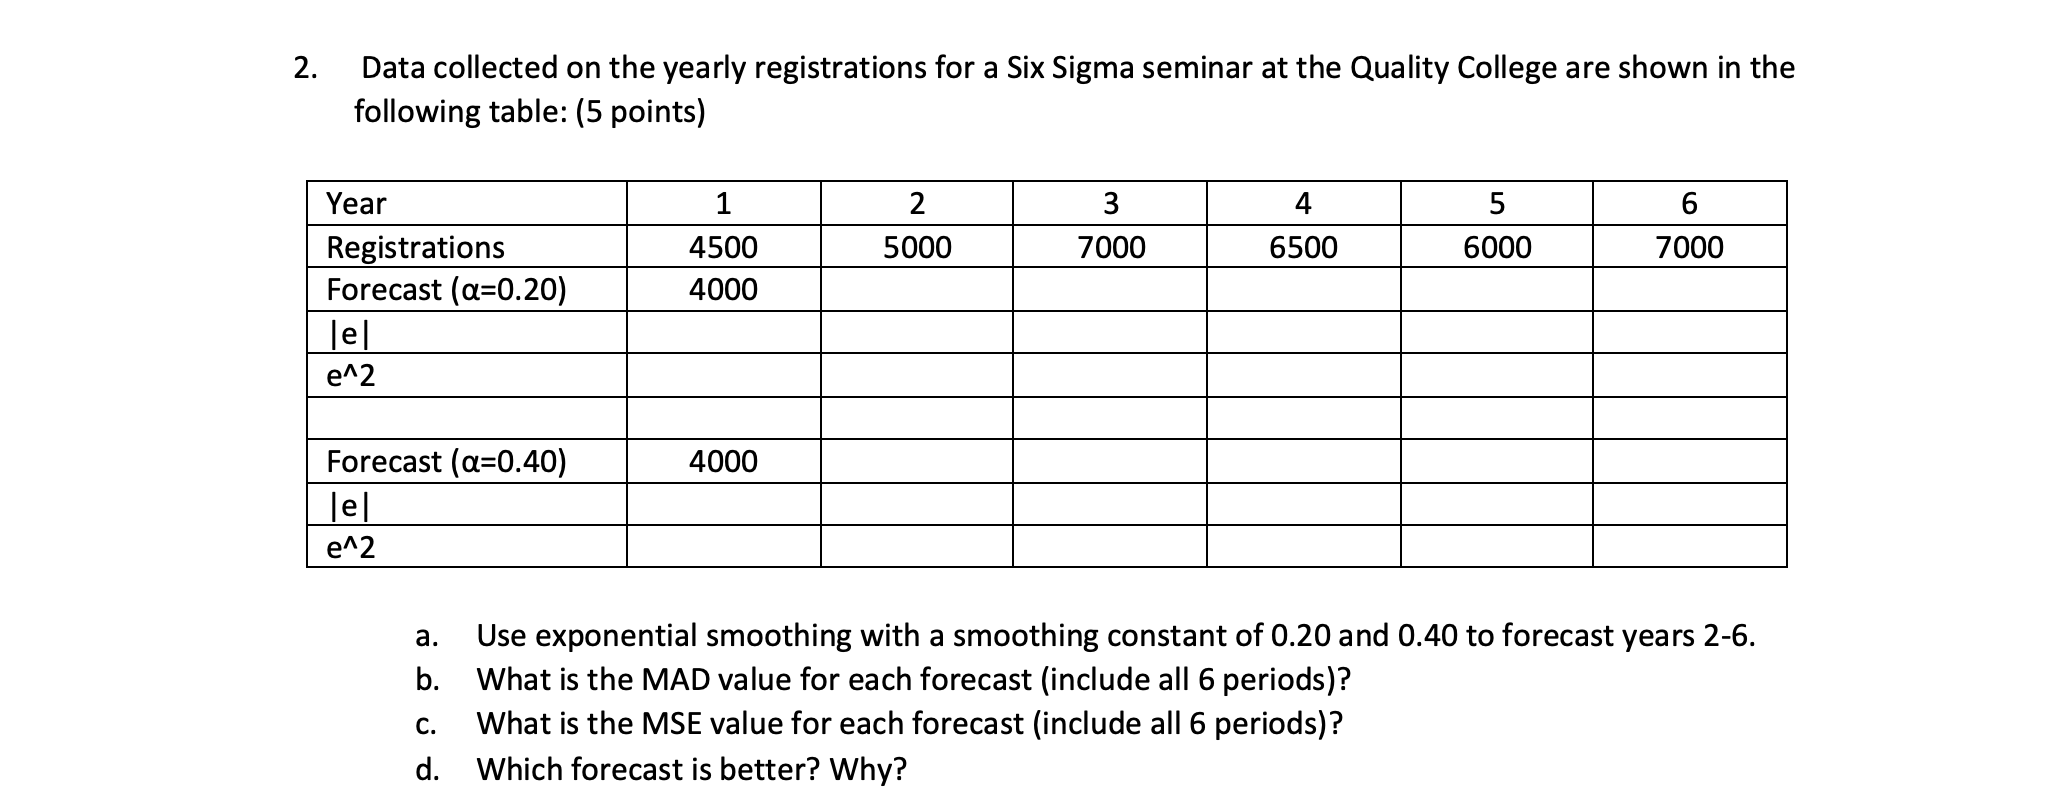
2. Data collected on the yearly registrations for a Six Sigma seminar at the Quality College are shown in the following table: (5 points) 2 3 4 1 4500 4000 5 6000 6 7000 5000 7000 Year Registrations Forecast (a=0.20) lel e^2 6500 4000 Forecast (a=0.40) lel e^2 a. Use exponential smoothing with a smoothing constant of 0.20 and 0.40 to forecast years 2-6. b. What is the MAD value for each forecast (include all 6 periods)? What is the MSE value for each forecast (include all 6 periods)? d. Which forecast is better? Why? CStep by Step Solution
There are 3 Steps involved in it
1 Expert Approved Answer
Step: 1 Unlock

Question Has Been Solved by an Expert!
Get step-by-step solutions from verified subject matter experts
Step: 2 Unlock
Step: 3 Unlock