

Question: Please show work 2. Now, examine the relationship between the poverty rate and adult obesity. a. What is your x variable and why? b. What
Please show work
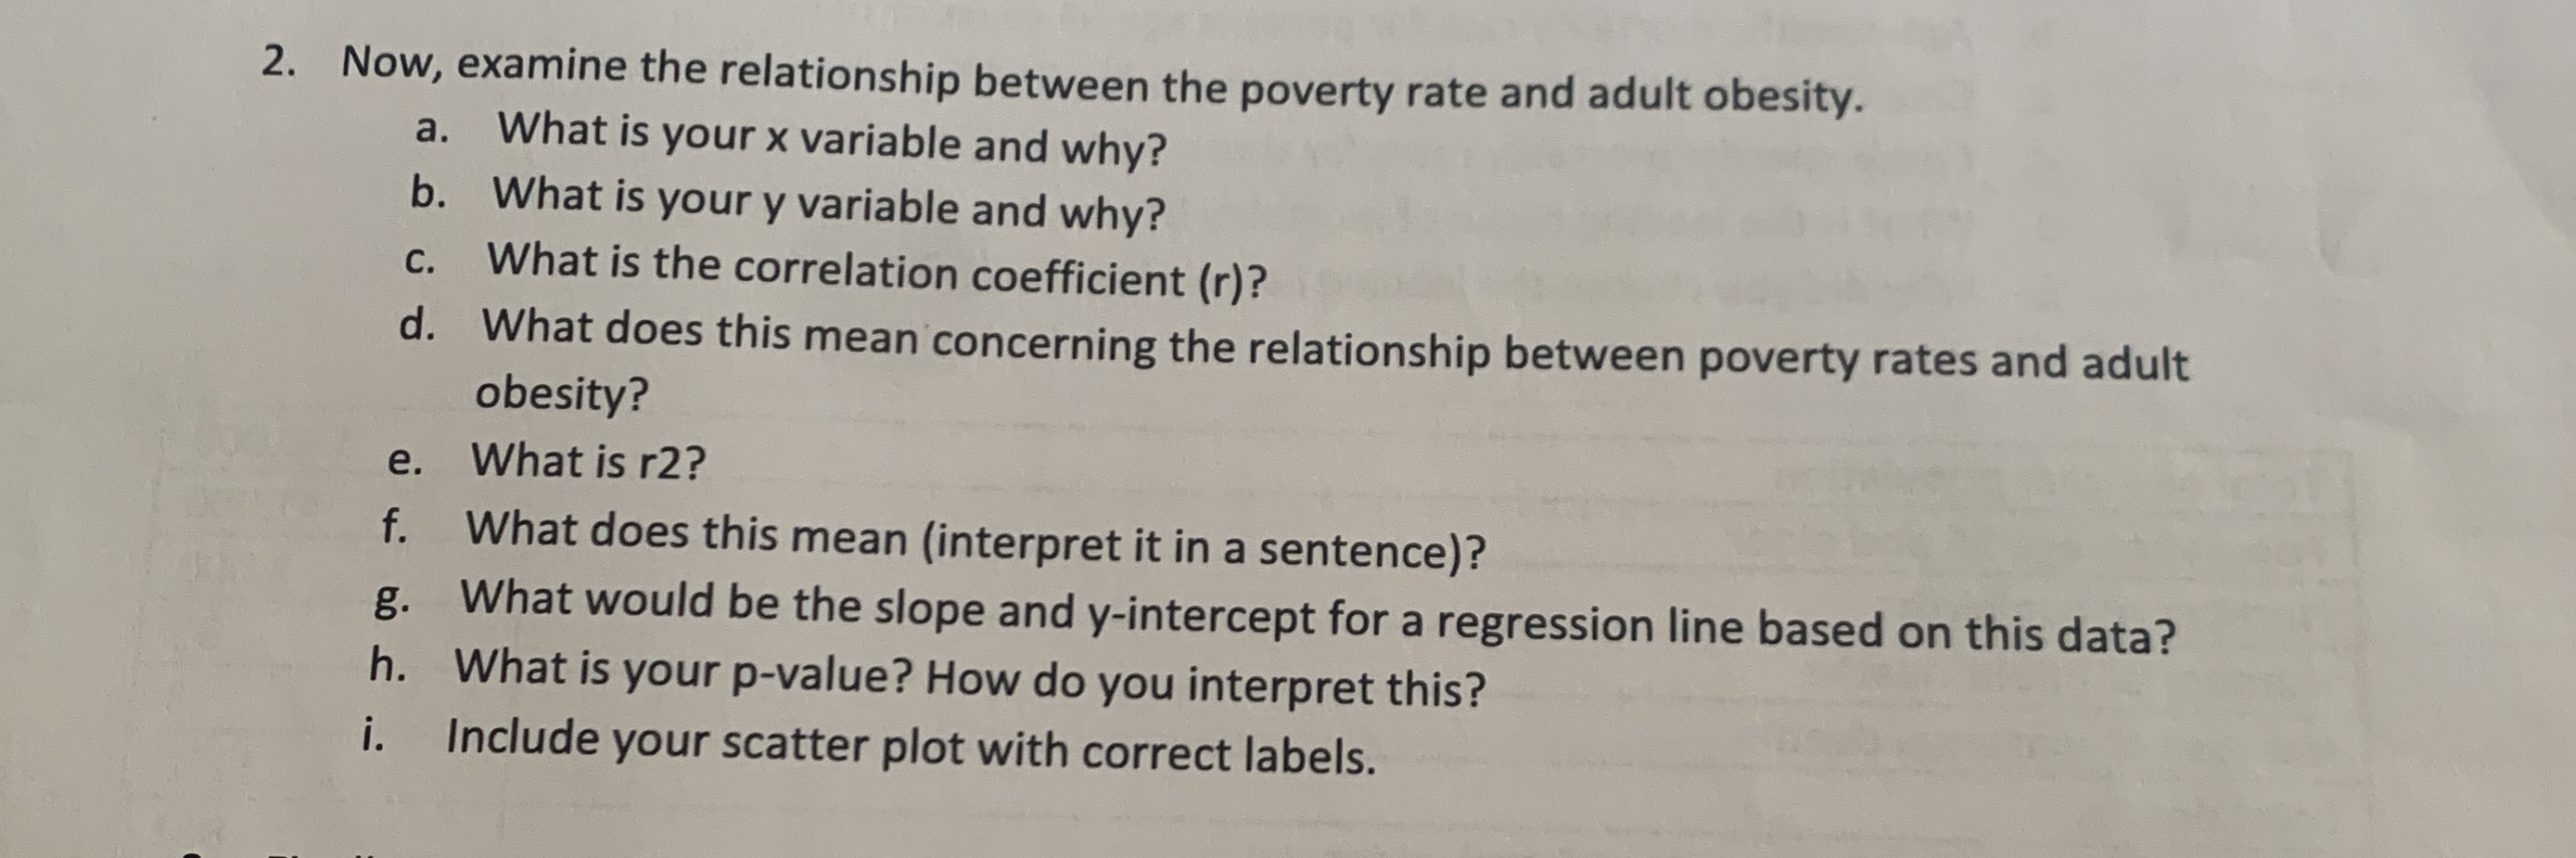
2. Now, examine the relationship between the poverty rate and adult obesity. a. What is your x variable and why? b. What is your y variable and why? c. What is the correlation coefficient (r)? d. What does this mean concerning the relationship between poverty rates and adult obesity? e. What is r2? f. What does this mean (interpret it in a sentence)? g. What would be the slope and y-intercept for a regression line based on this data? h. What is your p-value? How do you interpret this? i. Include your scatter plot with correct labels
Step by Step Solution
There are 3 Steps involved in it
1 Expert Approved Answer
Step: 1 Unlock

Question Has Been Solved by an Expert!
Get step-by-step solutions from verified subject matter experts
Step: 2 Unlock
Step: 3 Unlock