

Question: Please show work and all steps! The realized returns for stock A and stock B from 2004-2009 are provided in the table below Year Stock
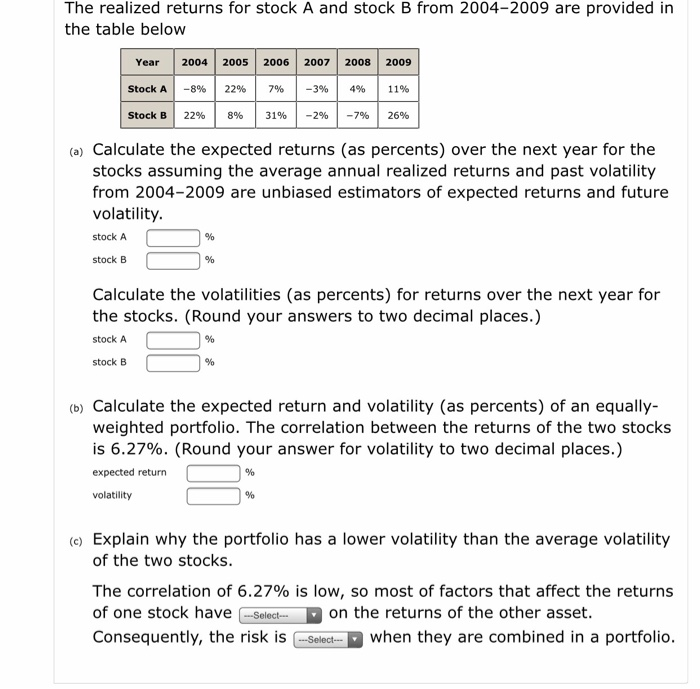
The realized returns for stock A and stock B from 2004-2009 are provided in the table below Year Stock A Stock B 2004 -8% 22% 2005 22% 8% 2006 7% 31% 2007 -3% -2% 2008 4% -7% 2009 11% 26% (a) Calculate the expected returns (as percents) over the next year for the stocks assuming the average annual realized returns and past volatility from 2004-2009 are unbiased estimators of expected returns and future volatility. stock A stock B Calculate the volatilities (as percents) for returns over the next year for the stocks. (Round your answers to two decimal places.) stock A 0 % stock B C (b) Calculate the expected return and volatility (as percents) of an equally- weighted portfolio. The correlation between the returns of the two stocks is 6.27%. (Round your answer for volatility to two decimal places.) expected return 0 % volatility (c) Explain why the portfolio has a lower volatility than the average volatility of the two stocks. The correlation of 6.27% is low, so most of factors that affect the returns of one stock have ---Select on the returns of the other asset. Consequently, the risk is --Select-- when they are combined in a portfolio
Step by Step Solution
There are 3 Steps involved in it

Get step-by-step solutions from verified subject matter experts