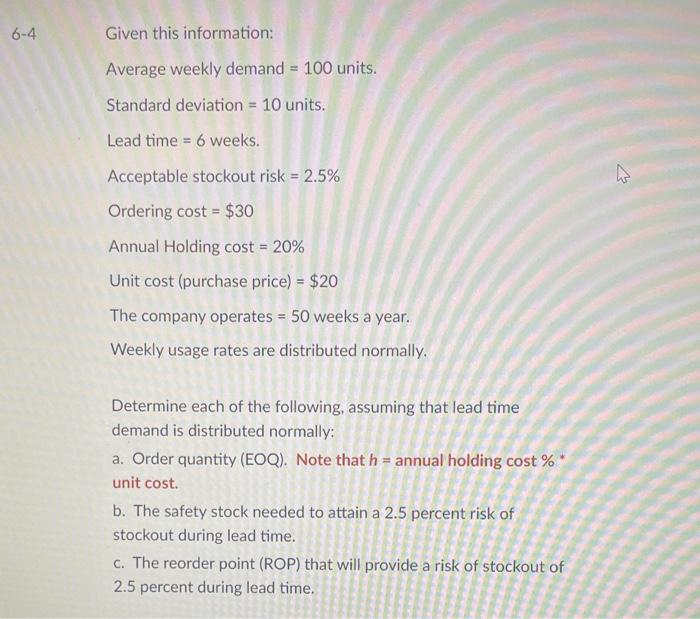
Question: Please show work and complete in excel or a chart if possible. Given this information: Average weekly demand =100 units. Standard deviation =10 units. Lead

Please show work and complete in excel or a chart if possible.
Please show work and complete in excel or a chart
Given this information: Average weekly demand =100 units. Standard deviation =10 units. Lead time =6 weeks . Acceptable stockout risk =2.5% Ordering cost =$30 Annual Holding cost =20% Unit cost (purchase price) =$20 The company operates =50 weeks a year. Weekly usage rates are distributed normally. Determine each of the following, assuming that lead time demand is distributed normally: a. Order quantity (EOQ). Note that h= annual holding cost % * unit cost. b. The safety stock needed to attain a 2.5 percent risk of stockout during lead time. c. The reorder point (ROP) that will provide a risk of stockout of 2.5 percent during lead time

Step by Step Solution

There are 3 Steps involved in it

1 Expert Approved Answer
Step: 1 Unlock blur-text-image
Question Has Been Solved by an Expert!

Get step-by-step solutions from verified subject matter experts

Step: 2 Unlock
Step: 3 Unlock

Students Have Also Explored These Related General Management Questions!