

Question: . please show work and develop x and r chart Winter 2022 Question 1: A quality analyst wants to use control charts for controlling a
 .
.
please show work and develop x and r chart
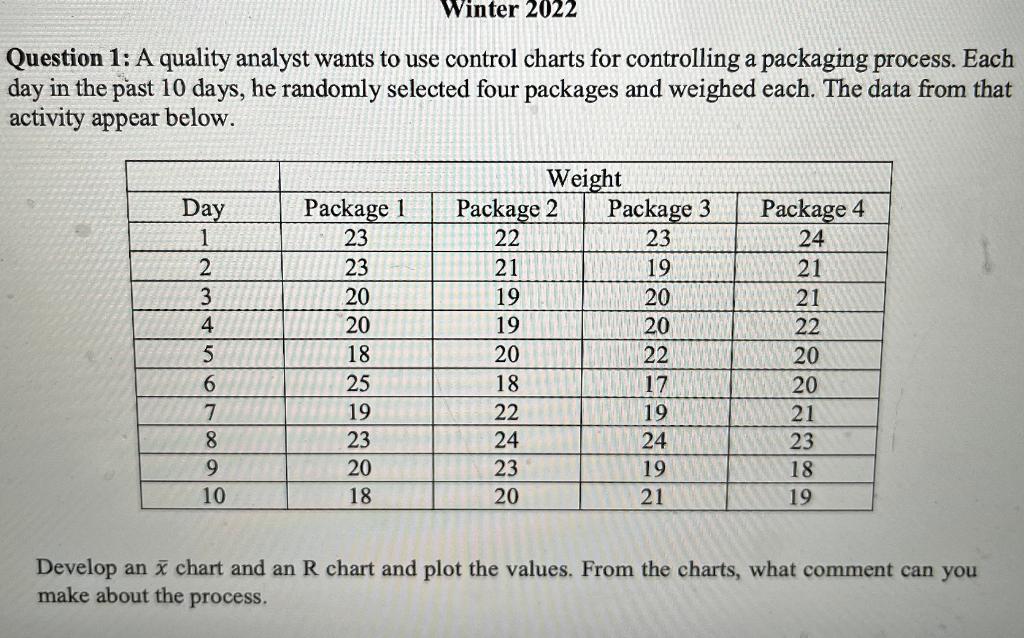
Winter 2022 Question 1: A quality analyst wants to use control charts for controlling a packaging process. Each day in the past 10 days, he randomly selected four packages and weighed each. The data from that activity appear below. Day 1 2 3 4 5 6 7 8 9 10 Package 1 23 23 20 20 18 25 19 23 20 18 Weight Package 2 Package 3 22 23 21 19 19 20 19 20 20 22 18 17 22 19 24 24 23 19 20 21 Package 4 24 21 21 22 20 20 21 23 18 19 Develop an chart and an R chart and plot the values. From the charts, what comment can you make about the processStep by Step Solution
There are 3 Steps involved in it
1 Expert Approved Answer
Step: 1 Unlock

Question Has Been Solved by an Expert!
Get step-by-step solutions from verified subject matter experts
Step: 2 Unlock
Step: 3 Unlock