

Question: Question 1: A quality analyst wants to use control charts for controlling a packaging process. Each day in the past 10 days, he randomly
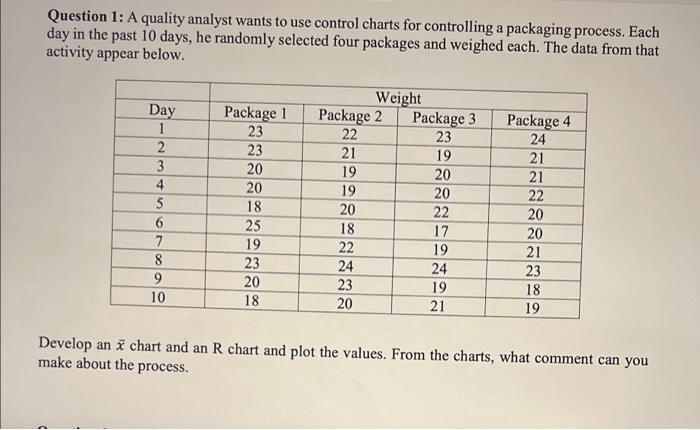
Question 1: A quality analyst wants to use control charts for controlling a packaging process. Each day in the past 10 days, he randomly selected four packages and weighed each. The data from that activity appear below. Weight Package 3 Day Package 1 23 Package 2 Package 4 1 22 23 24 2 23 21 19 21 3 20 19 20 21 4 20 19 20 22 17 22 5 18 20 20 6. 25 18 20 19 22 19 21 8 23 24 24 23 9. 20 23 19 18 10 18 20 21 19 Develop an i chart and an R chart and plot the values. From the charts, what comment can you make about the process.
Step by Step Solution
3.52 Rating (152 Votes )
There are 3 Steps involved in it
XiL mean of sample day Ri z pange f 9th sanple 2 322... View full answer

Get step-by-step solutions from verified subject matter experts