

Question: please show work and explain how you got the answer 2. Below is a set of sorted data. The critical values of this data are
please show work and explain how you got the answer
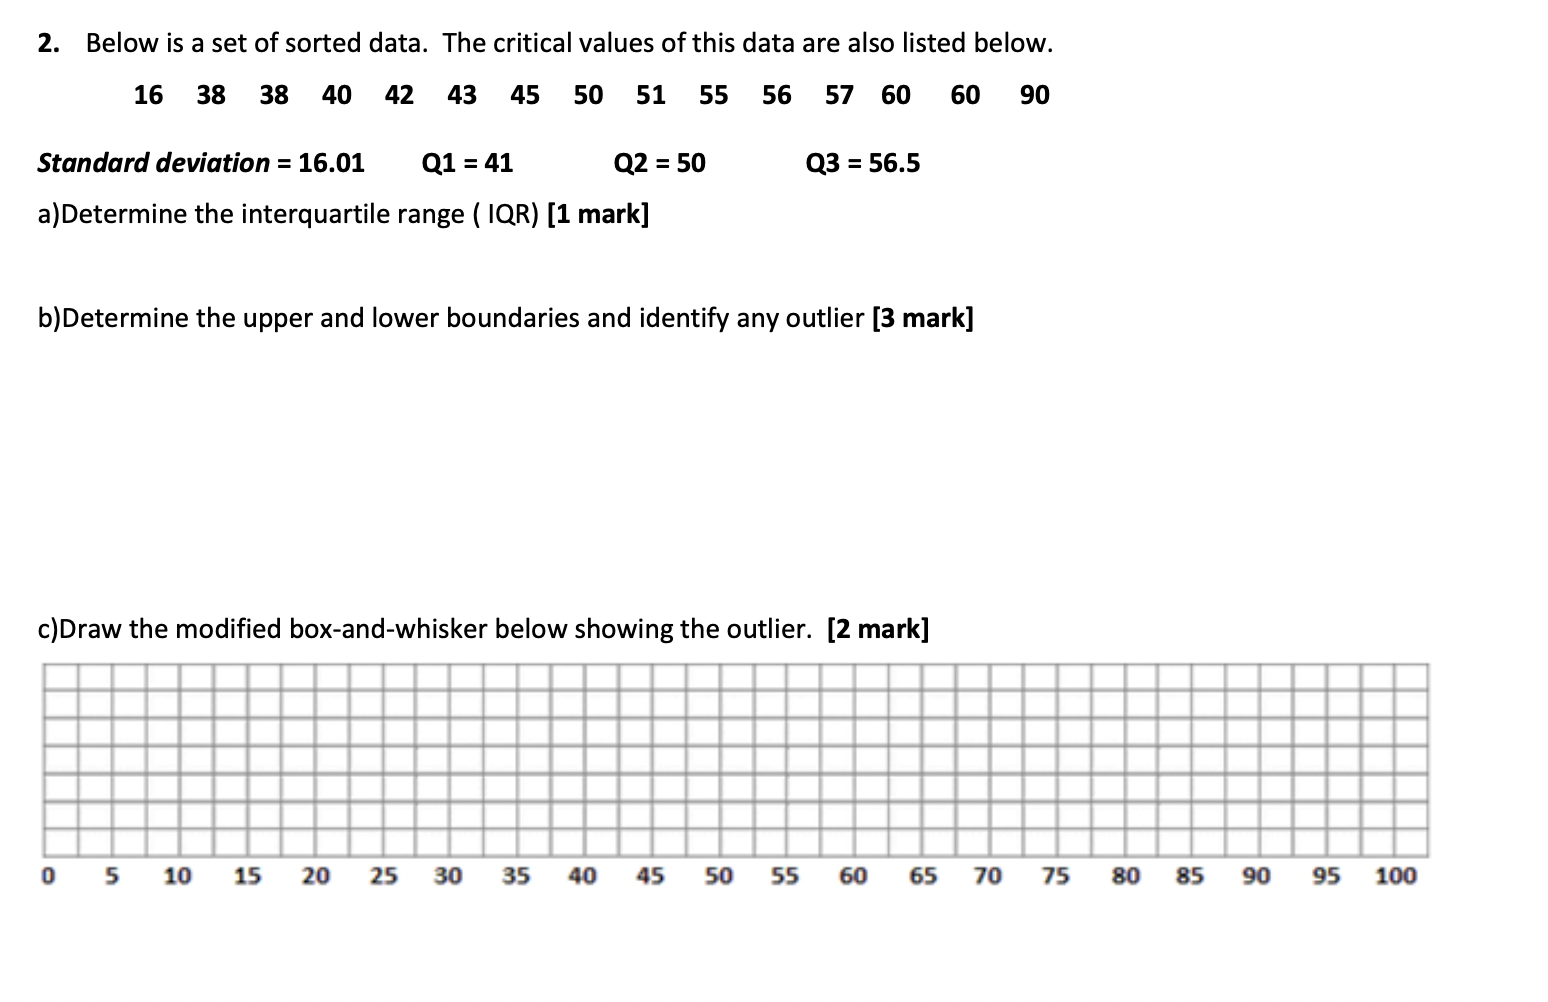
2. Below is a set of sorted data. The critical values of this data are also listed below. 16 38 38 40 42 43 45 50 51 55 56 57 60 60 90 Standard deviation = 16.01 Q1 = 41 Q2 = 50 Q3 = 56.5 a) Determine the interquartile range ( IQR) [1 mark] b) Determine the upper and lower boundaries and identify any outlier [3 mark] c)Draw the modified box-and-whisker below showing the outlier. [2 mark] 0 5 10 15 20 25 30 35 40 45 50 55 60 65 70 75 80 85 90 95 100
Step by Step Solution
There are 3 Steps involved in it
1 Expert Approved Answer
Step: 1 Unlock

Question Has Been Solved by an Expert!
Get step-by-step solutions from verified subject matter experts
Step: 2 Unlock
Step: 3 Unlock