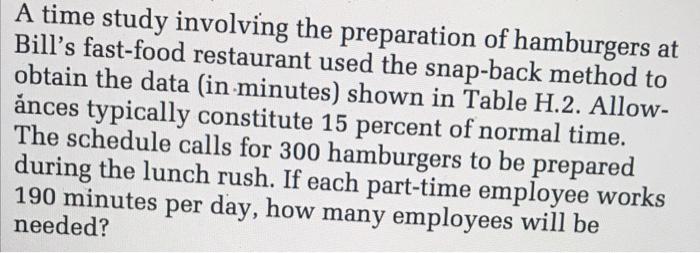
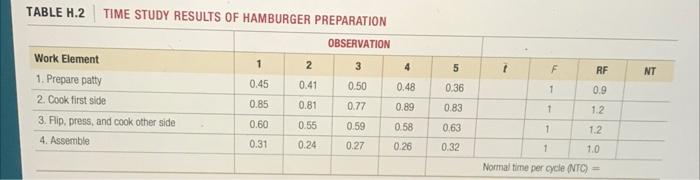
Question: please show work and explain where nt numbers come from. A time study involving the preparation of hamburgers at Bill's fast-food restaurant used the snap-back

please show work and explain where nt numbers come from.
please show work and explain where nt numbers
A time study involving the preparation of hamburgers at Bill's fast-food restaurant used the snap-back method to obtain the data (in minutes) shown in Table H.2. Allow- nces typically constitute 15 percent of normal time. The schedule calls for 300 hamburgers to be prepared during the lunch rush. If each part-time employee works 190 minutes per day, how many employees will be needed? TABLE H.2 TIME STUDY RESULTS OF HAMBURGER PREPARATION OBSERVATION 1 2 3 4 5 F RF NT 0.45 0.41 0.50 0.48 0.36 1 0.9 Work Element 1. Prepare patty 2. Cook first side 3. Flip. press, and cook other side 4. Assemble 0.81 0.77 0.89 0.83 1 12 0.85 0.60 0.31 0.55 0.59 0.58 0.63 1 0.24 1.2 1.0 0.27 0.26 0.32 1 Normal time per cycle (NTC) =

Step by Step Solution

There are 3 Steps involved in it

1 Expert Approved Answer
Step: 1 Unlock blur-text-image
Question Has Been Solved by an Expert!

Get step-by-step solutions from verified subject matter experts

Step: 2 Unlock
Step: 3 Unlock

Students Have Also Explored These Related General Management Questions!