

Question: please show work and will attach another image it might help?Appendix 2 We have data that is normal. There are 23 subgroups with 5 samples
please show work and will attach another image it might help?Appendix 2
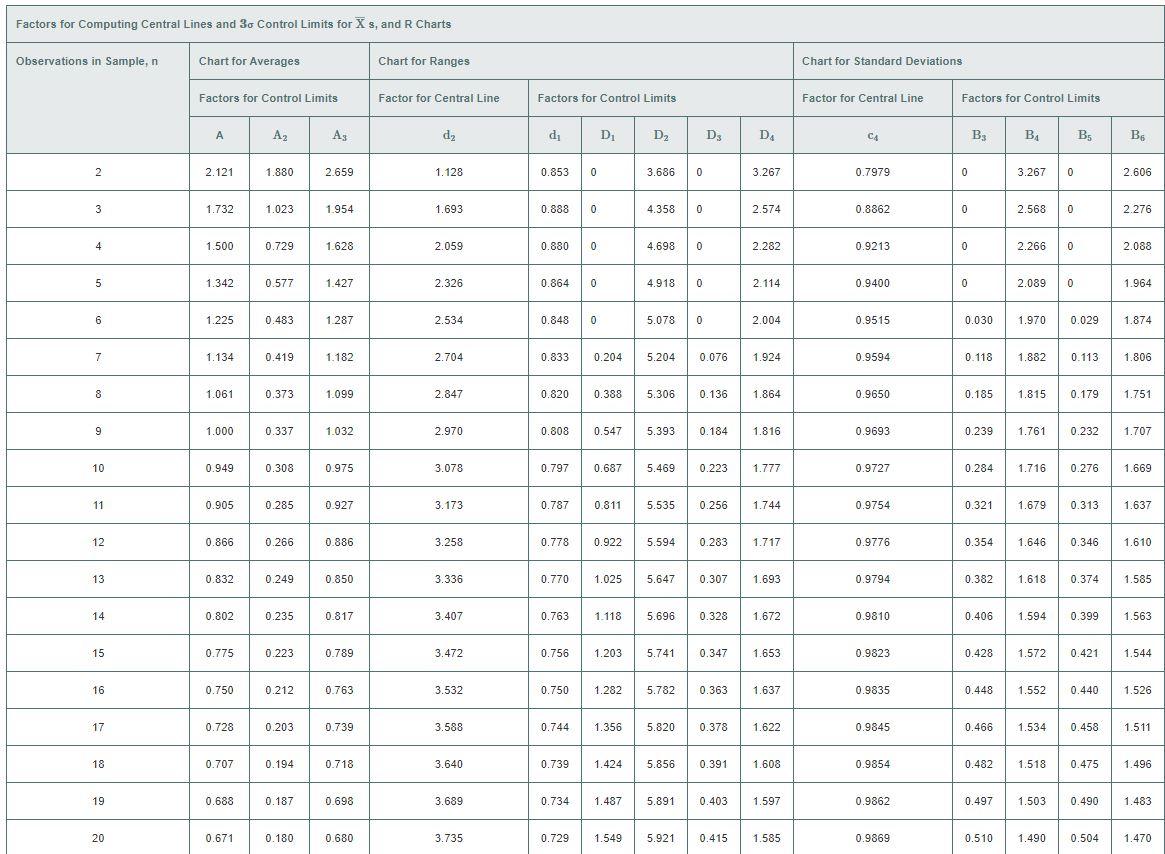
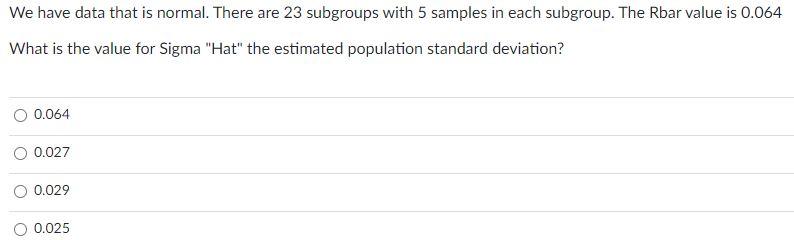
We have data that is normal. There are 23 subgroups with 5 samples in each subgroup. The Rbar value is 0.064 What is the value for Sigma "Hat" the estimated population standard deviation? 0.064 0.027 0.029 0.025 Factors for Computing Central Lines and 30 Control Limits for X s, and R Charts Observations in Sample, n , n Chart for Averages Chart for Ranges Chart for Standard Deviations Factors for Control Limits Factor for Central Line Factors for Control Limits Factor for Central Line Factors for Control Limits A Az Az dz di D D2 D DA C4 B3 B B: B6 2 2.121 1.880 2.659 1.128 0.853 0 3.686 0 3.267 0.7979 0 3.267 0 2.606 3 1.732 1.023 1.954 1.693 0.888 0 4.358 0 2.574 0.8862 0 2.568 0 2.276 4 1.500 0.729 1.628 2.059 0.880 0 4.698 0 2.282 0.9213 0 2.266 0 2.088 5 1.342 0.577 1.427 2.326 0.864 0 0 4.918 0 2.114 0.9400 0 2.089 0 1.964 6 1.225 0.483 1.287 2.534 0.848 0 5.078 0 0 2.004 0.9515 0.030 1.970 0.029 1.874 7 1.134 0.419 1.182 2.704 0.833 0.204 5.204 0.076 1.924 0.9594 0.118 1.882 0.113 1.806 8 1.061 0.373 1.099 2.847 0.820 0.388 5.306 0.136 1.864 0.9650 0.185 1.815 0.179 1.751 9 1.000 0.337 1.032 2.970 0.808 0.547 5.393 0.184 1.816 0.9693 0.239 1.761 0.232 1.707 10 0.949 0.308 0.975 3.078 0.797 0.687 5.469 0.223 1.777 0.9727 0.284 1.716 0.276 1.669 11 0.905 0.285 0.927 3.173 0.787 0.811 5.535 0.256 1.744 0.9754 0.321 1.679 0.313 1.637 12 0.866 0.266 0.886 3.258 0.778 0.922 5.594 0.283 1.717 0.9776 0.354 1.646 0.346 1.610 13 0.832 0.249 0.850 3.336 0.770 1.025 5.647 0.307 1.693 0.9794 0.382 1.618 0.374 1.585 14 0.802 0.235 0.817 3.407 0.763 1.118 5.696 0.328 1.672 0.9810 0.406 1.594 0.399 1.563 15 0.775 0.223 0.789 3.472 0.756 1.203 5.741 0.347 1.653 0.9823 0.428 1.572 0.421 1.544 16 0.750 0.212 0.763 3.532 0.750 1.282 5.782 0.363 1.637 0.9835 0.448 1.552 0.440 1.526 17 0.728 0.203 0.739 3.588 0.744 1.356 5.820 0.378 1.622 0.9845 0.466 1.534 0.458 1.511 18 0.707 0.194 0.718 3.640 0.739 1.424 5.856 0.391 1.608 0.9854 0.482 1.518 0.475 1.496 19 0.688 0.187 0.698 3.689 0.734 1.487 5.891 0.403 1.597 0.9862 0.497 1.503 0.490 1.483 20 0.671 0.180 0.680 3.735 0.729 1.549 5.921 0.415 1.585 0.9869 0.510 1.490 0.504 1.470
Step by Step Solution
There are 3 Steps involved in it

Get step-by-step solutions from verified subject matter experts