

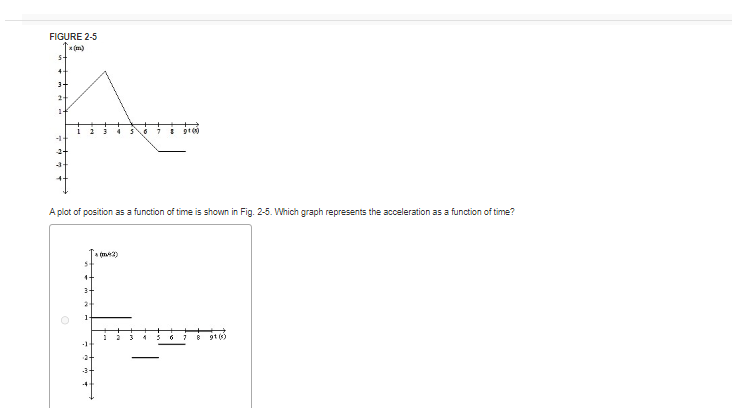
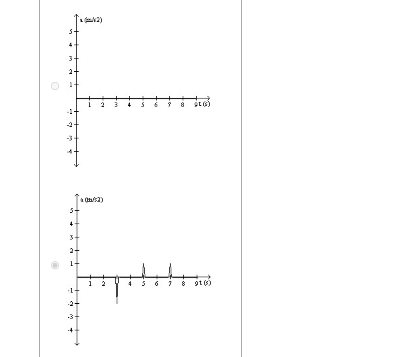
Question: PLEASE SHOW WORK AS POSSIBLE VERY CLEARLY STEP BY STEP, THANK YOU. FIGURE 2-5 (m) 4- 3- -1 -3- -4- A plot of position as

PLEASE SHOW WORK AS POSSIBLE VERY CLEARLY STEP BY STEP, THANK YOU.


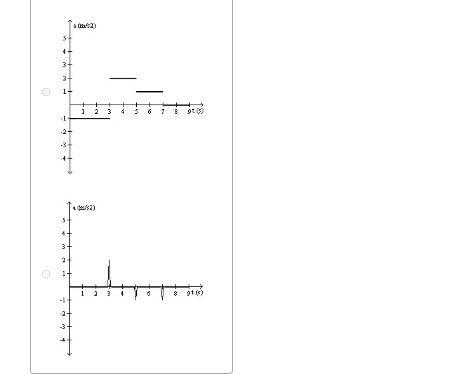
FIGURE 2-5 (m) 4- 3- -1 -3- -4- A plot of position as a function of time is shown in Fig. 2-5. Which graph represents the acceleration as a function of time? 3- O 1- g1 (3) .3-
Step by Step Solution
There are 3 Steps involved in it
1 Expert Approved Answer
Step: 1 Unlock

Question Has Been Solved by an Expert!
Get step-by-step solutions from verified subject matter experts
Step: 2 Unlock
Step: 3 Unlock