Question: Please show work & formulas. Lecture 7 Mini Case Solid Metal Background Solid Metal is a fairly large-sized manufacturing firm which produced unique metal products
Please show work & formulas.
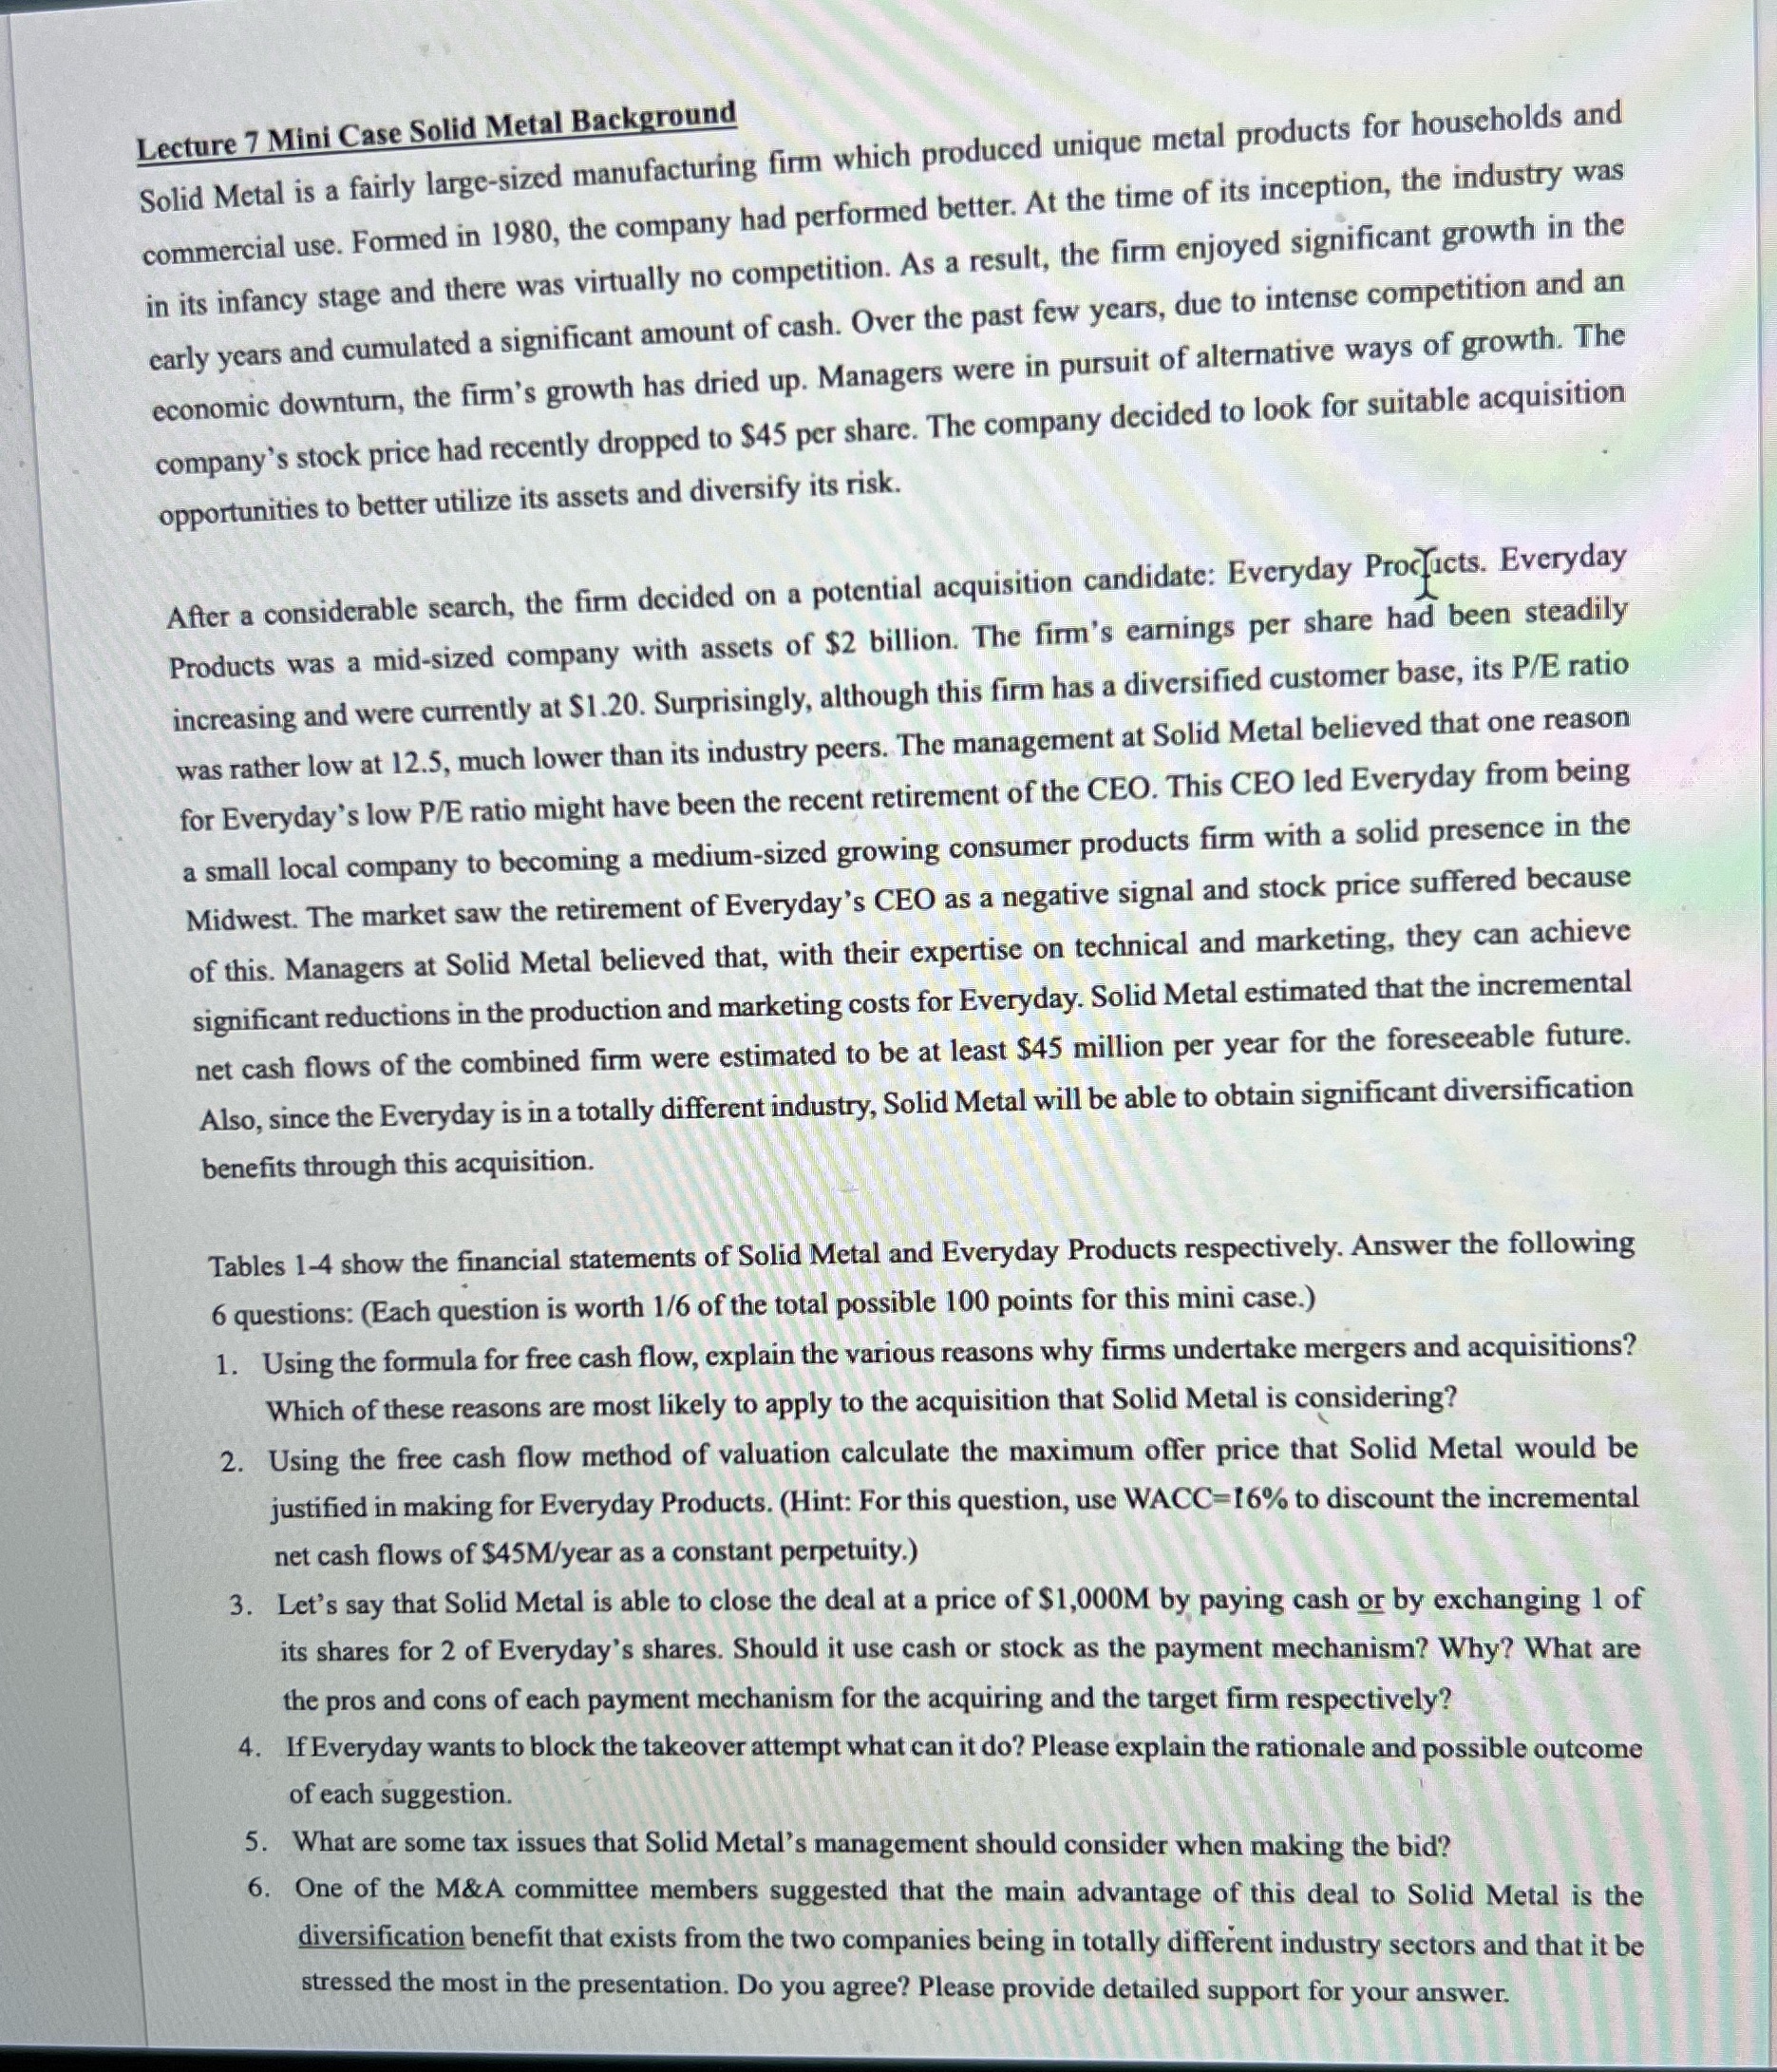
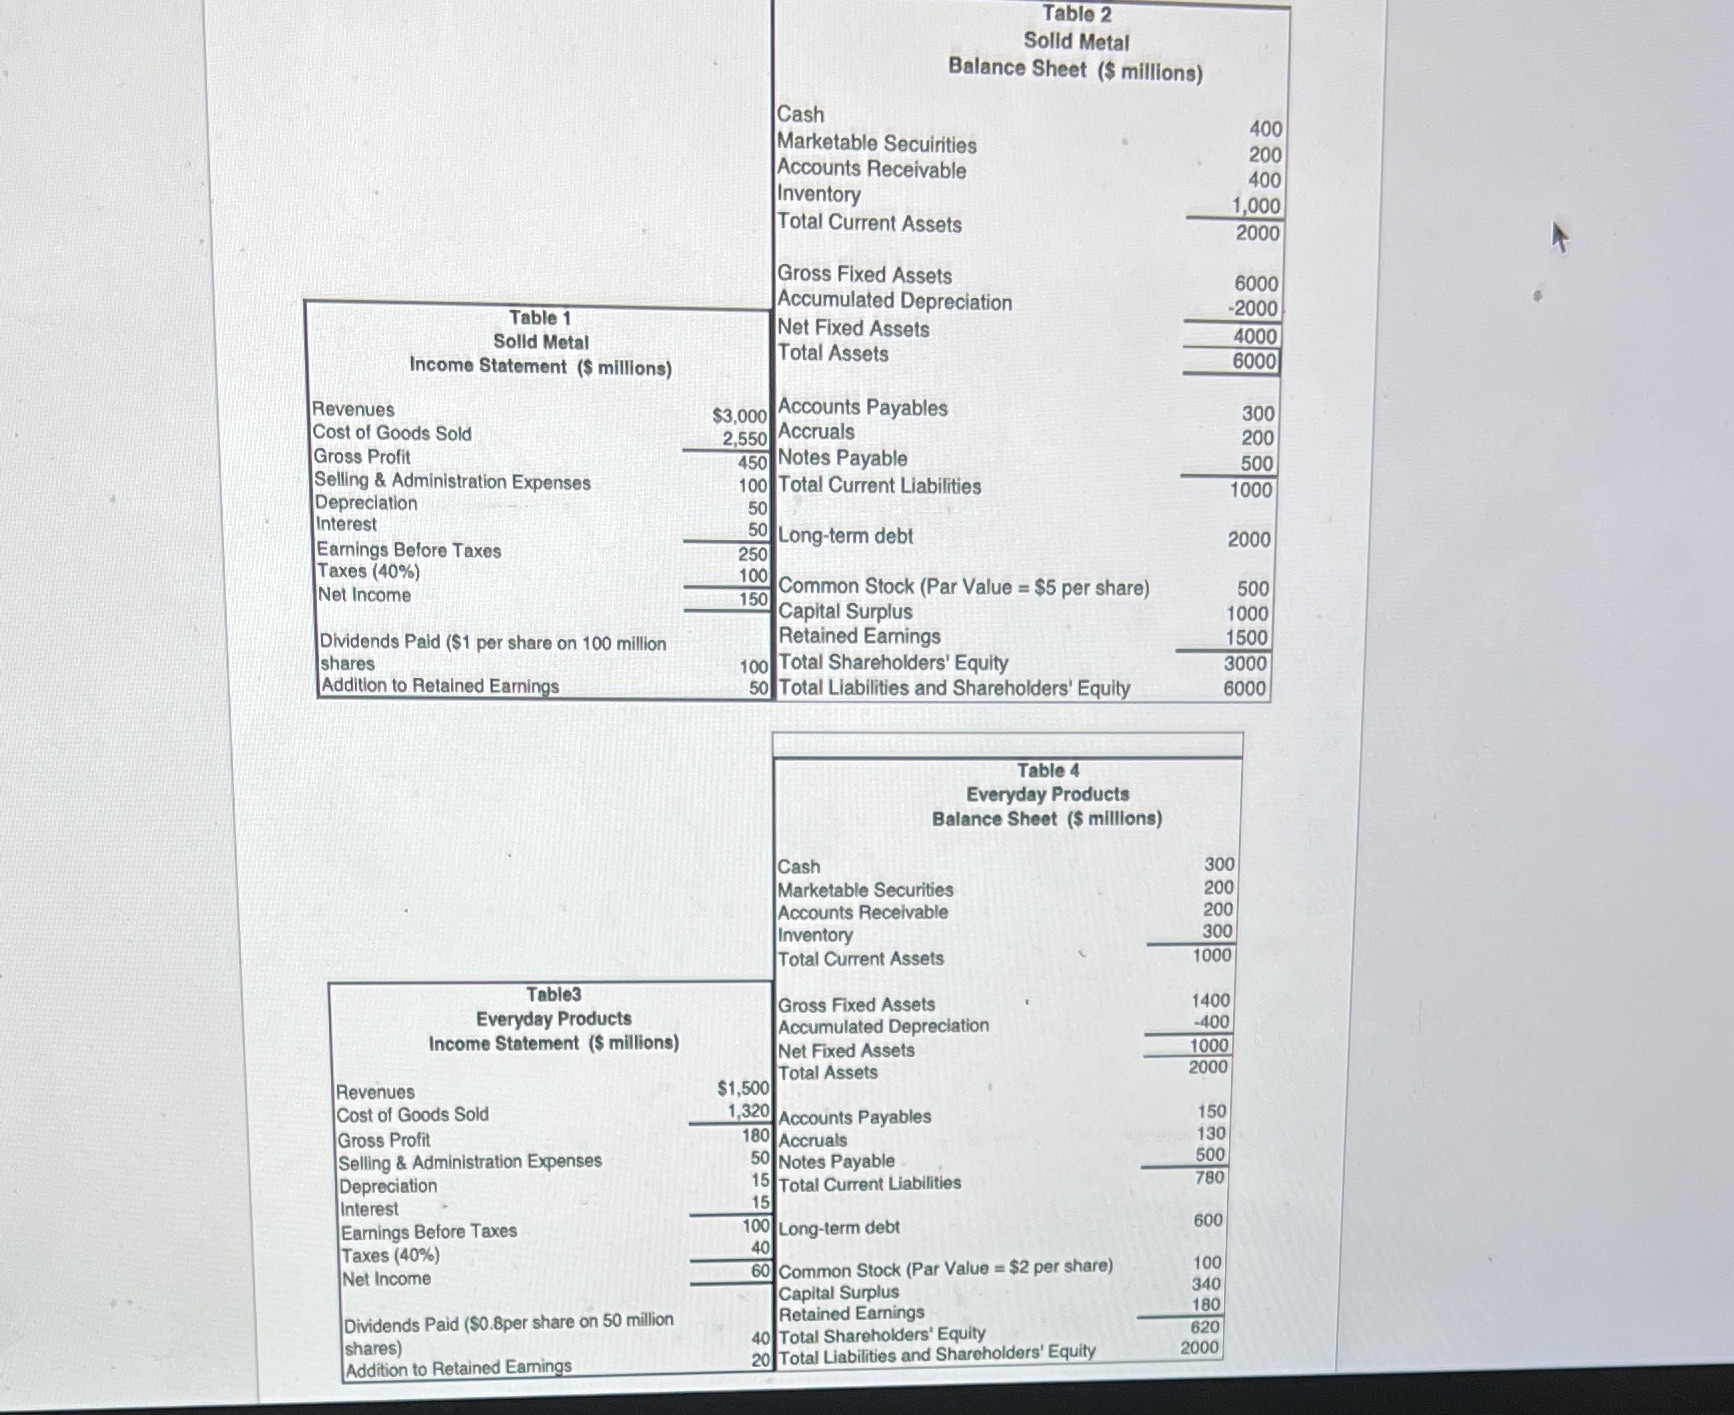
Lecture 7 Mini Case Solid Metal Background Solid Metal is a fairly large-sized manufacturing firm which produced unique metal products for households and commercial use. Formed in 1980, the company had performed better. At the time of its inception, the industry was in its infancy stage and there was virtually no competition. As a result, the firm enjoyed significant growth in the early years and cumulated a significant amount of cash. Over the past few years, due to intense competition and an economic downturn, the firm's growth has dried up. Managers were in pursuit of alternative ways of growth. The company's stock price had recently dropped to $45 per share. The company decided to look for suitable acquisition opportunities to better utilize its assets and diversify its risk. After a considerable search, the firm decided on a potential acquisition candidate: Everyday Products. Everyday Products was a mid-sized company with assets of $2 billion. The firm's earnings per share had been steadily increasing and were currently at $1.20. Surprisingly, although this firm has a diversified customer base, its P/E ratio was rather low at 12.5, much lower than its industry peers. The management at Solid Metal believed that one reason for Everyday's low P/E ratio might have been the recent retirement of the CEO. This CEO led Everyday from being a small local company to becoming a medium-sized growing consumer products firm with a solid presence in the Midwest. The market saw the retirement of Everyday's CEO as a negative signal and stock price suffered because of this. Managers at Solid Metal believed that, with their expertise on technical and marketing, they can achieve significant reductions in the production and marketing costs for Everyday. Solid Metal estimated that the incremental net cash flows of the combined firm were estimated to be at least $45 million per year for the foreseeable future. Also, since the Everyday is in a totally different industry, Solid Metal will be able to obtain significant diversification benefits through this acquisition. Tables 1-4 show the financial statements of Solid Metal and Everyday Products respectively. Answer the following 6 questions: (Each question is worth 1/6 of the total possible 100 points for this mini case.) 1. Using the formula for free cash flow, explain the various reasons why firms undertake mergers and acquisitions? Which of these reasons are most likely to apply to the acquisition that Solid Metal is considering? 2. Using the free cash flow method of valuation calculate the maximum offer price that Solid Metal would be justified in making for Everyday Products. (Hint: For this question, use WACC=16% to discount the incremental net cash flows of $45M/year as a constant perpetuity.) Let's say that Solid Metal is able to close the deal at a price of $1,000M by paying cash or by exchanging 1 of its shares for 2 of Everyday's shares. Should it use cash or stock as the payment mechanism? Why? What are the pros and cons of each payment mechanism for the acquiring and the target firm respectively? 4. If Everyday wants to block the takeover attempt what can it do? Please explain the rationale and possible outcome of each suggestion. 5. What are some tax issues that Solid Metal's management should consider when making the bid? 6. One of the M&A committee members suggested that the main advantage of this deal to Solid Metal is the diversification benefit that exists from the two companies being in totally different industry sectors and that it be stressed the most in the presentation. Do you agree? Please provide detailed support for your answer.Table 2 Solid Metal Balance Sheet ($ millions) Cash 400 Marketable Securities 200 Accounts Receivable 400 Inventory 1,000 Total Current Assets 2000 Gross Fixed Assets 6000 Accumulated Depreciation Table 1 2000 Net Fixed Assets Solid Metal 4000 Total Assets Income Statement ($ millions) 6000 Revenues $3,000 Accounts Payables 300 Cost of Goods Sold 2,550 Accruals 200 Gross Profit 450 Notes Payable 500 Selling & Administration Expenses 100 Total Current Liabilities 1000 Depreciation 50 Interest 50 Long-term debt 2000 Earnings Before Taxes 250 Taxes (40%) 100 Net Income 150 Common Stock (Par Value = $5 per share) 500 Capital Surplus 1000 Dividends Paid ($1 per share on 100 million Retained Earnings 1500 shares 100 Total Shareholders' Equity 3000 Addition to Retained Earnings 50 Total Liabilities and Shareholders' Equity 6000 Table 4 Everyday Products Balance Sheet ($ millions) Cash 300 Marketable Securities 200 Accounts Receivable 200 Inventory 300 Total Current Assets 1000 Table3 Gross Fixed Assets 1400 Everyday Products Accumulated Depreciation 400 Income Statement ($ millions) Net Fixed Assets 1000 Total Assets 2000 Revenues $1,500 Cost of Goods Sold 1,320 Accounts Payables 150 Gross Profit 180 Accruals 130 Selling & Administration Expenses 50 Notes Payable 500 15 Total Current Liabilities 780 Depreciation Interest 15 0 Long-term debt 600 Earnings Before Taxes Taxes (40%) 40 60 Common Stock (Par Value = $2 per share) 100 Net Income Capital Surplus 340 Dividends Paid ($0.8per share on 50 million Retained Earnings 180 620 40 Total Shareholders' Equity shares) 20 Total Liabilities and Shareholders' Equity 2000 Addition to Retained Earnings