

Question: Please show work in Excel. The following table reports the sale of umbrellas for 12 quarters. Quarter Year 1 Year 2 Year 3 1 4
Please show work in Excel. 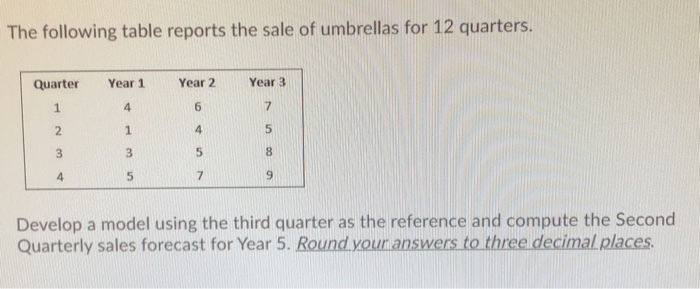
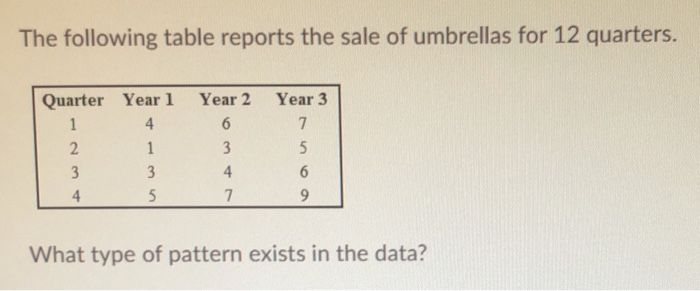
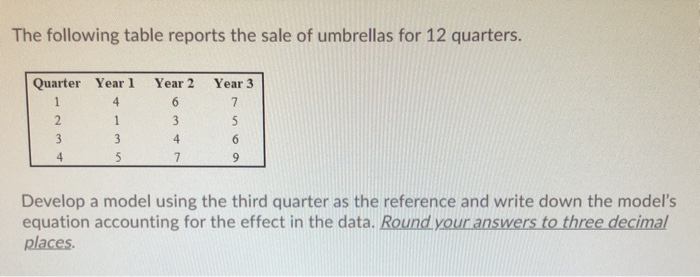
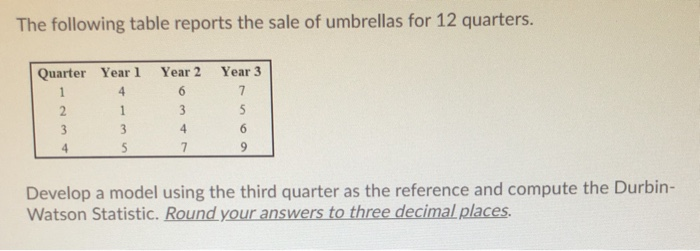
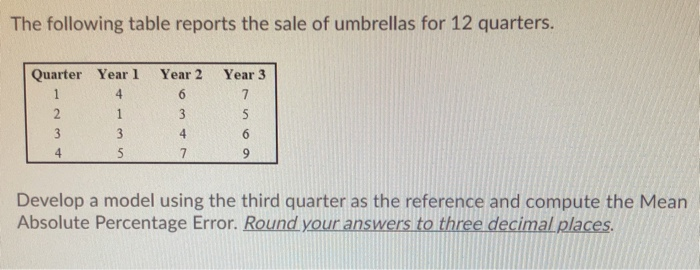
The following table reports the sale of umbrellas for 12 quarters. Quarter Year 1 Year 2 Year 3 1 4 6 7 2 1 4 5 3 3 5 8 4 5 7. 9 Develop a model using the third quarter as the reference and compute the Second Quarterly sales forecast for Year 5. Round your answers to three decimal places. The following table reports the sale of umbrellas for 12 quarters. Quarter Year 1 1 4 2 1 3 3 4 5 Year 2 6 3 4 7 Year 3 7 5 6 9 What type of pattern exists in the data? The following table reports the sale of umbrellas for 12 quarters. Year 3 Quarter Year 1 1 4 2 Year 2 6 3 3 3 4 7 5 6 9 4 5 Develop a model using the third quarter as the reference and write down the model's equation accounting for the effect in the data. Round your answers to three decimal places. The following table reports the sale of umbrellas for 12 quarters. Year 3 7 Quarter Year 1 1 4 2 1 3 3 5 Year 2 6 3 4 7 6 9 Develop a model using the third quarter as the reference and compute the Durbin- Watson Statistic. Round your answers to three decimal places. The following table reports the sale of umbrellas for 12 quarters. Quarter Year 1 1 4 2 1 3 3 4 5 Year 2 6 3 Year 3 7 5 6 9 4 7 Develop a model using the third quarter as the reference and compute the Mean Absolute Percentage Error. Round your answers to three decimal places. The following table reports the sale of umbrellas for 12 quarters. Quarter Year 1 Year 2 Year 3 1 4 6 7 2 1 4 5 3 3 5 8 4 5 7. 9 Develop a model using the third quarter as the reference and compute the Second Quarterly sales forecast for Year 5. Round your answers to three decimal places. The following table reports the sale of umbrellas for 12 quarters. Quarter Year 1 1 4 2 1 3 3 4 5 Year 2 6 3 4 7 Year 3 7 5 6 9 What type of pattern exists in the data? The following table reports the sale of umbrellas for 12 quarters. Year 3 Quarter Year 1 1 4 2 Year 2 6 3 3 3 4 7 5 6 9 4 5 Develop a model using the third quarter as the reference and write down the model's equation accounting for the effect in the data. Round your answers to three decimal places. The following table reports the sale of umbrellas for 12 quarters. Year 3 7 Quarter Year 1 1 4 2 1 3 3 5 Year 2 6 3 4 7 6 9 Develop a model using the third quarter as the reference and compute the Durbin- Watson Statistic. Round your answers to three decimal places. The following table reports the sale of umbrellas for 12 quarters. Quarter Year 1 1 4 2 1 3 3 4 5 Year 2 6 3 Year 3 7 5 6 9 4 7 Develop a model using the third quarter as the reference and compute the Mean Absolute Percentage Error. Round your answers to three decimal places Step by Step Solution
There are 3 Steps involved in it
1 Expert Approved Answer
Step: 1 Unlock

Question Has Been Solved by an Expert!
Get step-by-step solutions from verified subject matter experts
Step: 2 Unlock
Step: 3 Unlock