

Question: Please show work in full detail with formulas, i do not have excel and need to understand how the problem is worked by hand Quality
Please show work in full detail with formulas, i do not have excel and need to understand how the problem is worked by hand
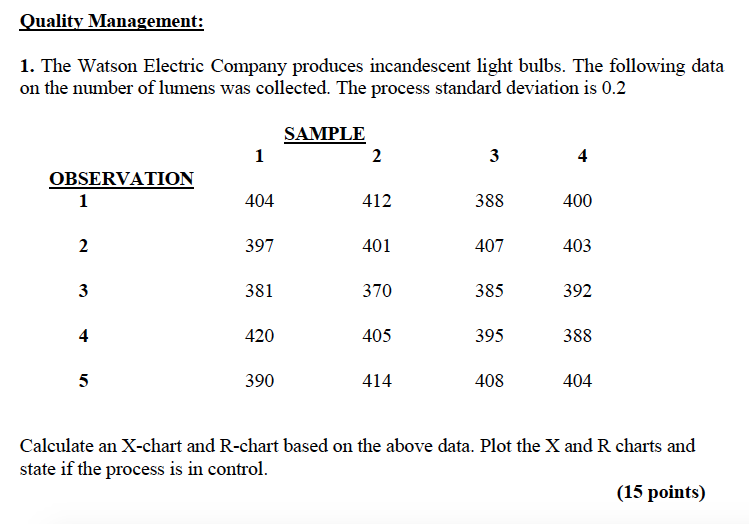
Quality Management: 1. The Watson Electric Company produces incandescent light bulbs. The following data on the number of lumens was collected. The process standard deviation is 0.2 SAMPLE 2 1 3 4 OBSERVATION 1 404 412 388 400 2 397 401 407 403 3 381 370 385 392 4 420 405 395 388 5 390 414 408 404 Calculate an X-chart and R-chart based on the above data. Plot the X and R charts and state if the process is in control. (15 points)Step by Step Solution
There are 3 Steps involved in it
1 Expert Approved Answer
Step: 1 Unlock

Question Has Been Solved by an Expert!
Get step-by-step solutions from verified subject matter experts
Step: 2 Unlock
Step: 3 Unlock