

Question: Please show work in full detail with formulas, i do not have excel and need to understand how the problem is worked by hand 2.
Please show work in full detail with formulas, i do not have excel and need to understand how the problem is worked by hand
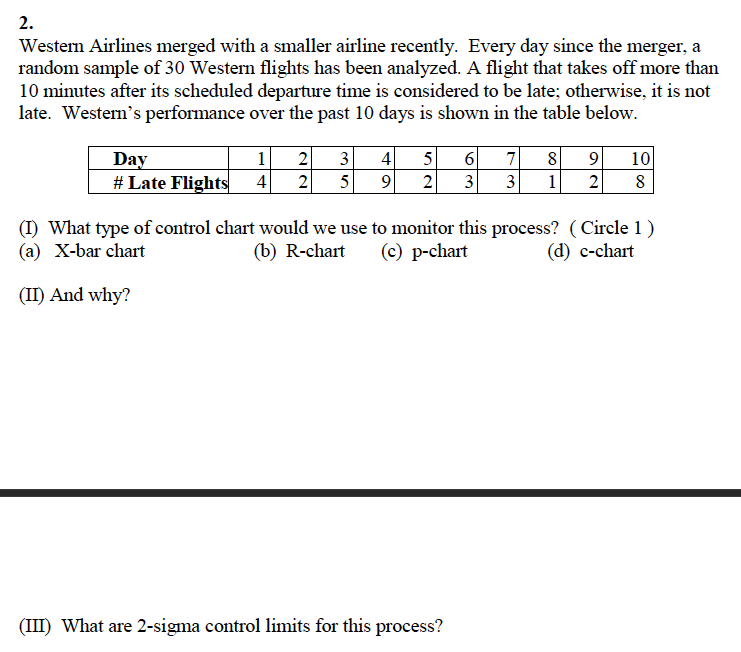
2. Western Airlines merged with a smaller airline recently. Every day since the merger, a random sample of 30 Western flights has been analyzed. A flight that takes off more than 10 minutes after its scheduled departure time is considered to be late; otherwise, it is not late. Western's performance over the past 10 days is shown in the table below. 1 Day # Late Flights 2 2 3 5 4 9 5 2 6 3 71 3 8 1 9 2 10 8 4 (I) What type of control chart would we use to monitor this process? (Circle 1) (a) X-bar chart (b) R-chart (c) p-chart (d) c-chart (II) And why? (III) What are 2-sigma control limits for this processStep by Step Solution
There are 3 Steps involved in it
1 Expert Approved Answer
Step: 1 Unlock

Question Has Been Solved by an Expert!
Get step-by-step solutions from verified subject matter experts
Step: 2 Unlock
Step: 3 Unlock