

Question: Please show work or steps used on calculator Chapter 10 5. A researcher wants to see if there is a relationship between the number of
Please show work or steps used on calculator
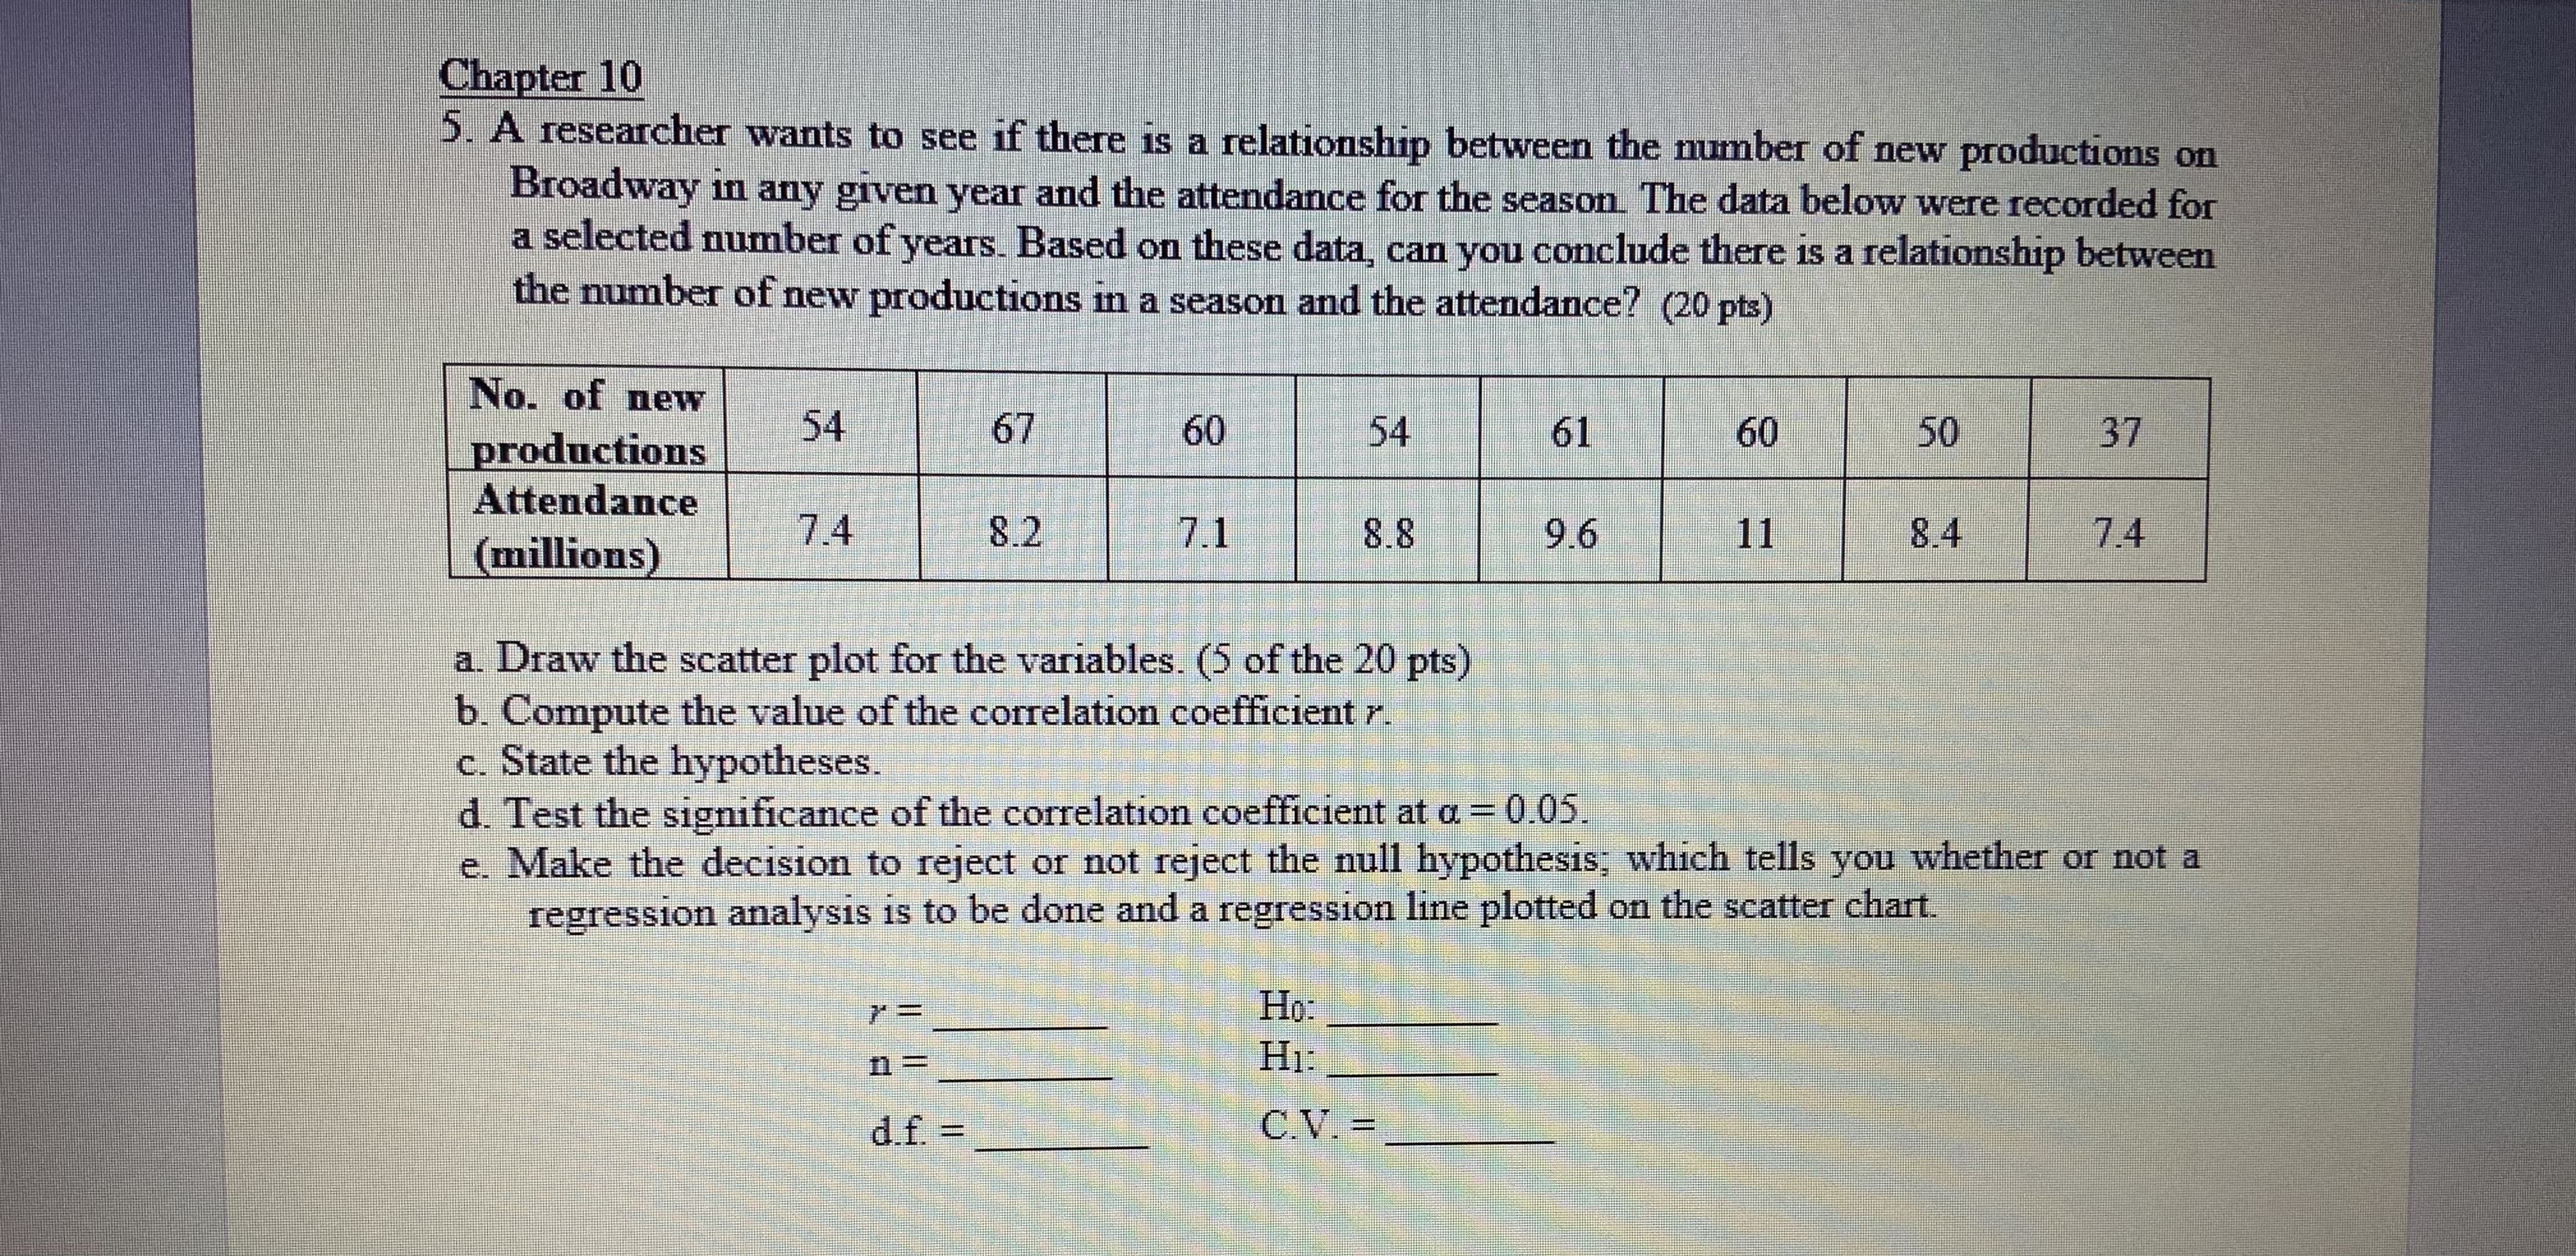
Chapter 10 5. A researcher wants to see if there is a relationship between the number of new productions on Broadway in any given year and the attendance for the season. The data below were recorded for a selected number of years. Based on these data, can you conclude there is a relationship between the number of new productions in a season and the attendance? (20 pts) No. of new 54 67 productions 60 54 61 60 50 37 Attendance 7.4 (millions) 8.2 7.1 8.8 9.6 11 8.4 7.4 a. Draw the scatter plot for the variables. (5 of the 20 pts) b. Compute the value of the correlation coefficient r. c. State the hypotheses. d. Test the significance of the correlation coefficient at a = 0.05. e. Make the decision to reject or not reject the null hypothesis; which tells you whether or not a regression analysis is to be done and a regression line plotted on the scatter chart. Ho: n = H1: d.f. = C.V. =
Step by Step Solution
There are 3 Steps involved in it

Get step-by-step solutions from verified subject matter experts