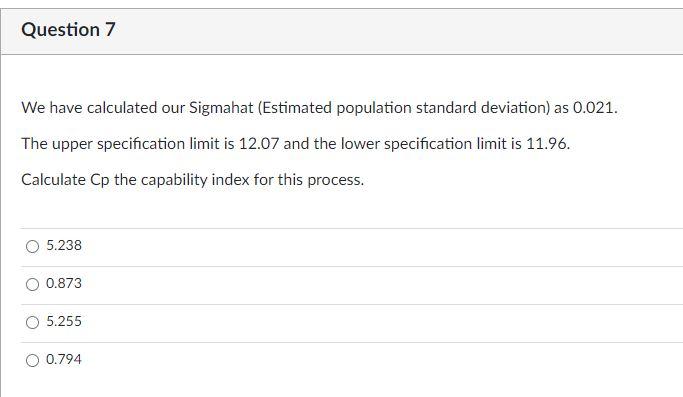
Question: please show work Question 7 We have calculated our Sigmahat (Estimated population standard deviation) as 0.021. The upper specification limit is 12.07 and the lower

please show work Question 7 We have calculated

please show work

please show work Question 7 We have calculated

Question 7 We have calculated our Sigmahat (Estimated population standard deviation) as 0.021. The upper specification limit is 12.07 and the lower specification limit is 11.96. Calculate Cp the capability index for this process. 5.238 0.873 5.255 0.794 Factors for Computing Central Lines and 30 Control Limits for X s, and R Charts Observations in Sample, n , n Chart for Averages Chart for Ranges Chart for Standard Deviations Factors for Control Limits Factor for Central Line Factors for Control Limits Factor for Central Line Factors for Control Limits A Az Az dz di D D2 D DA C4 B3 B B: B6 2 2.121 1.880 2.659 1.128 0.853 0 3.686 0 3.267 0.7979 0 3.267 0 2.606 3 1.732 1.023 1.954 1.693 0.888 0 4.358 0 2.574 0.8862 0 2.568 0 2.276 4 1.500 0.729 1.628 2.059 0.880 0 4.698 0 2.282 0.9213 0 2.266 0 2.088 5 1.342 0.577 1.427 2.326 0.864 0 0 4.918 0 2.114 0.9400 0 2.089 0 1.964 6 1.225 0.483 1.287 2.534 0.848 0 5.078 0 0 2.004 0.9515 0.030 1.970 0.029 1.874 7 1.134 0.419 1.182 2.704 0.833 0.204 5.204 0.076 1.924 0.9594 0.118 1.882 0.113 1.806 8 1.061 0.373 1.099 2.847 0.820 0.388 5.306 0.136 1.864 0.9650 0.185 1.815 0.179 1.751 9 1.000 0.337 1.032 2.970 0.808 0.547 5.393 0.184 1.816 0.9693 0.239 1.761 0.232 1.707 10 0.949 0.308 0.975 3.078 0.797 0.687 5.469 0.223 1.777 0.9727 0.284 1.716 0.276 1.669 11 0.905 0.285 0.927 3.173 0.787 0.811 5.535 0.256 1.744 0.9754 0.321 1.679 0.313 1.637 12 0.866 0.266 0.886 3.258 0.778 0.922 5.594 0.283 1.717 0.9776 0.354 1.646 0.346 1.610 13 0.832 0.249 0.850 3.336 0.770 1.025 5.647 0.307 1.693 0.9794 0.382 1.618 0.374 1.585 14 0.802 0.235 0.817 3.407 0.763 1.118 5.696 0.328 1.672 0.9810 0.406 1.594 0.399 1.563 15 0.775 0.223 0.789 3.472 0.756 1.203 5.741 0.347 1.653 0.9823 0.428 1.572 0.421 1.544 16 0.750 0.212 0.763 3.532 0.750 1.282 5.782 0.363 1.637 0.9835 0.448 1.552 0.440 1.526 17 0.728 0.203 0.739 3.588 0.744 1.356 5.820 0.378 1.622 0.9845 0.466 1.534 0.458 1.511 18 0.707 0.194 0.718 3.640 0.739 1.424 5.856 0.391 1.608 0.9854 0.482 1.518 0.475 1.496 19 0.688 0.187 0.698 3.689 0.734 1.487 5.891 0.403 1.597 0.9862 0.497 1.503 0.490 1.483 20 0.671 0.180 0.680 3.735 0.729 1.549 5.921 0.415 1.585 0.9869 0.510 1.490 0.504 1.470

Step by Step Solution

There are 3 Steps involved in it

1 Expert Approved Answer
Step: 1 Unlock blur-text-image
Question Has Been Solved by an Expert!

Get step-by-step solutions from verified subject matter experts

Step: 2 Unlock
Step: 3 Unlock

Students Have Also Explored These Related General Management Questions!