

Question: please show work .. resubmitting again.. TABLE 10.1 Year-by Year Total Returns 1926-2015 LONG-TERM GOVERNMENT BONDS 7.89 U.S. TREASURY BILLS LARGE-COMPANY STOCKS LARGE-COMPANY 1955 1956
please show work .. resubmitting again..
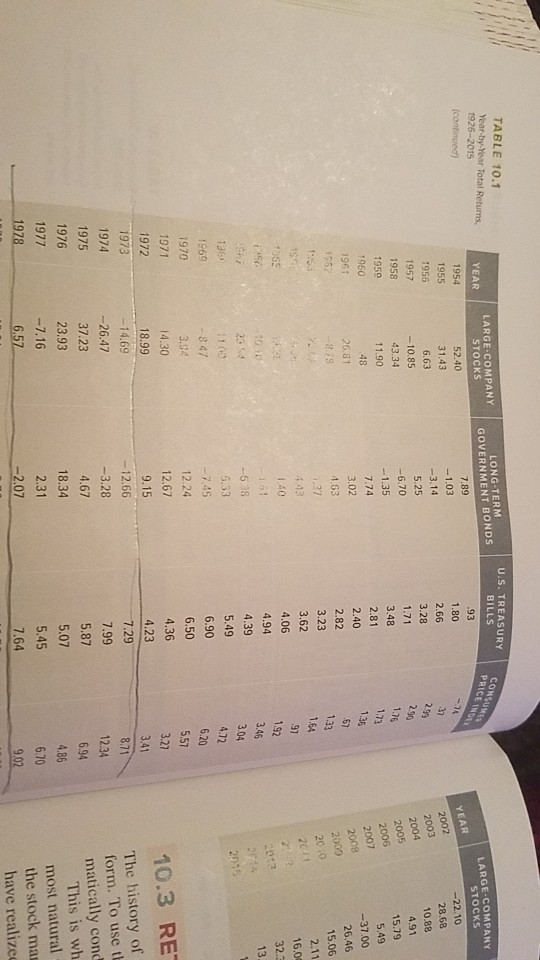
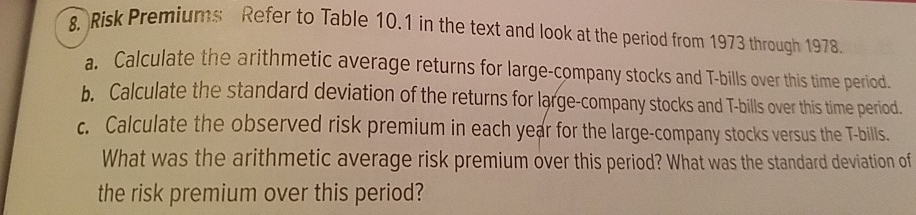
TABLE 10.1 Year-by Year Total Returns 1926-2015 LONG-TERM GOVERNMENT BONDS 7.89 U.S. TREASURY BILLS LARGE-COMPANY STOCKS LARGE-COMPANY 1955 1956 1957 1958 STOCKS -22.10 28.68 10.88 1.03 31.43 6.63 -10.85 43.34 11.90 YEAR 2002 1.71 3.48 2.81 1950 1.35 15.79 196 3.02 1.63 26.81 37.00 2.82 3.23 3.62 26.46 15.06 16.0 4.94 13 8.47 3.24 4.30 18.99 14.69 -26.47 37.23 1970 1971 1972 12.67 9.15 -12.66 -3.28 4.67 18.34 4.36 10.3 RE The history of form. To use t matically cond This is wh most natural the stock ma have realize 1974 5.87 5.07 5.45 7.64 23.93 1977 2.07 Risk Premiums a. Calculate the arithmetic average returns for large-company stocks and T-bills over this time period. b. Calculate the standard devi c. Calculate the observed risk premium in each year for the large-company stocks versus the T-blis. 8. Refer to Table 10.1 in the text and look at the period from 1973 through 1978. ation of the returns for large-company stocks and T-bills over this time period. What was the arithmetic average risk premium over this period? What was the standard deviation of the risk premium over this period
Step by Step Solution
There are 3 Steps involved in it

Get step-by-step solutions from verified subject matter experts