

Question: Please show work, will give thumbs up! Need help with problem 2 Problem 1 Emma Queen decided to open a food stand at the Bothell
Please show work, will give thumbs up!
Need help with problem 2
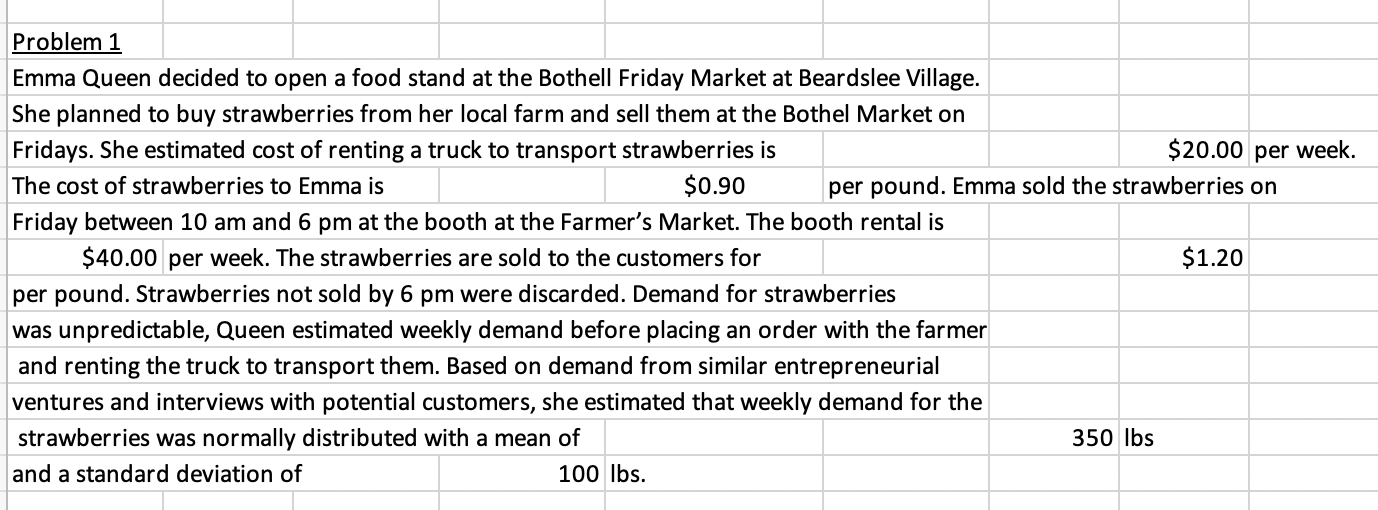
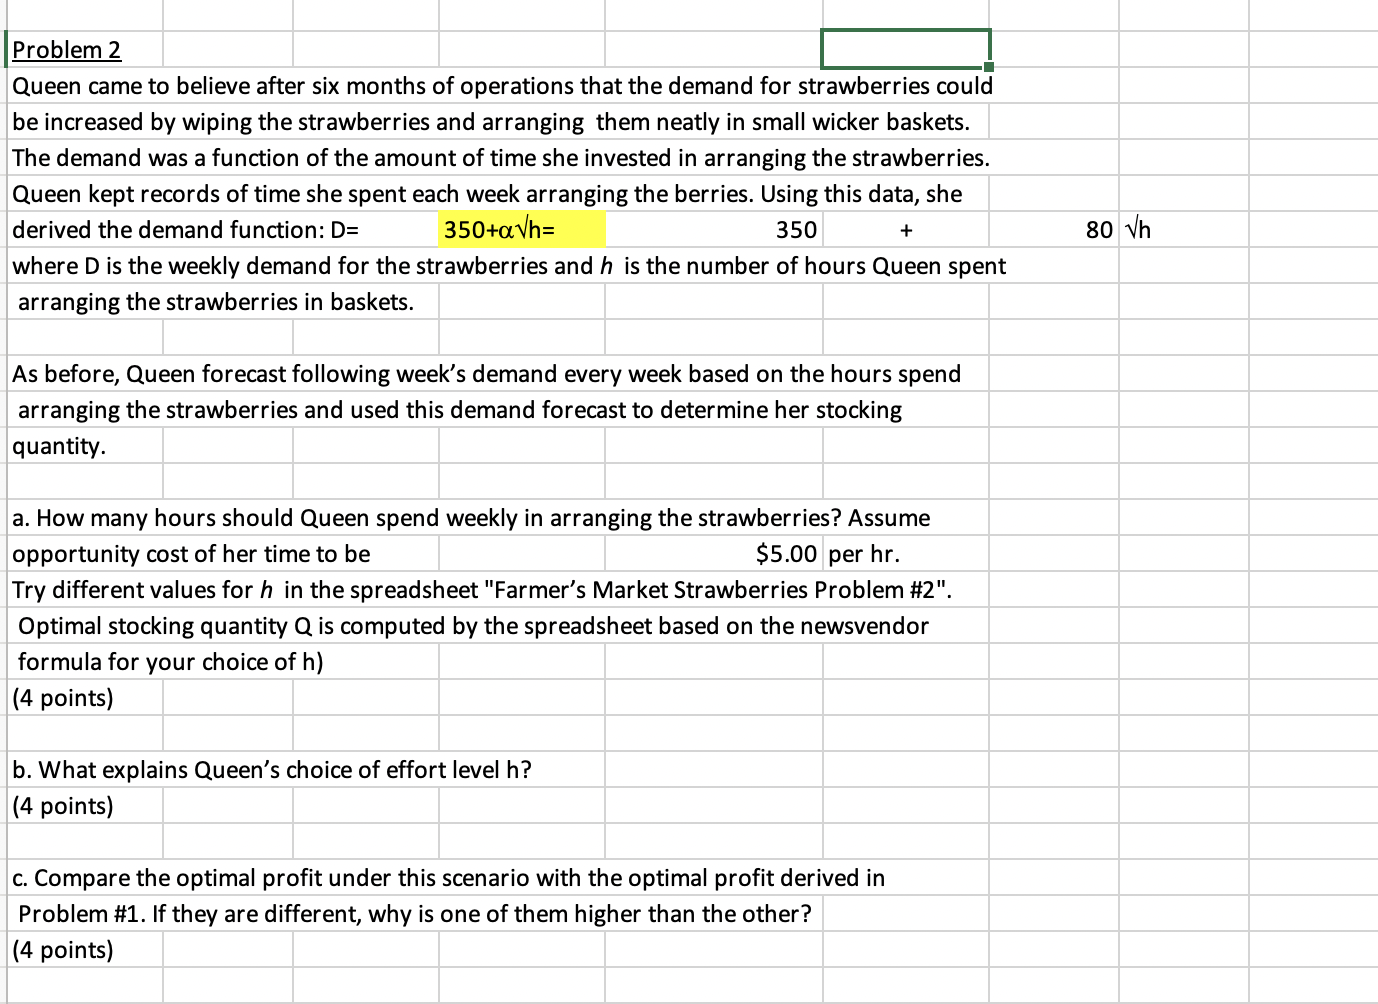
Problem 1 Emma Queen decided to open a food stand at the Bothell Friday Market at Beardslee Village. She planned to buy strawberries from her local farm and sell them at the Bothel Market on Fridays. She estimated cost of renting a truck to transport strawberries is $20.00 per week. The cost of strawberries to Emma is $0.90 per pound. Emma sold the strawberries on Friday between 10 am and 6 pm at the booth at the Farmer's Market. The booth rental is $40.00 per week. The strawberries are sold to the customers for $1.20 per pound. Strawberries not sold by 6 pm were discarded. Demand for strawberries was unpredictable, Queen estimated weekly demand before placing an order with the farmer and renting the truck to transport them. Based on demand from similar entrepreneurial ventures and interviews with potential customers, she estimated that weekly demand for the strawberries was normally distributed with a mean of 350 lbs and a standard deviation of 100 lbs. Problem 2 Queen came to believe after six months of operations that the demand for strawberries could be increased by wiping the strawberries and arranging them neatly in small wicker baskets. The demand was a function of the amount of time she invested in arranging the strawberries. Queen kept records of time she spent each week arranging the berries. Using this data, she derived the demand function: D= 350+avh= 350 where D is the weekly demand for the strawberries and h is the number of hours Queen spent arranging the strawberries in baskets. + 80 Vh As before, Queen forecast following week's demand every week based on the hours spend arranging the strawberries and used this demand forecast to determine her stocking quantity a. How many hours should Queen spend weekly in arranging the strawberries? Assume opportunity cost of her time to be $5.00 per hr. Try different values for h in the spreadsheet "Farmer's Market Strawberries Problem #2". Optimal stocking quantity Q is computed by the spreadsheet based on the newsvendor formula for your choice of h) (4 points) b. What explains Queen's choice of effort level h? (4 points) c. Compare the optimal profit under this scenario with the optimal profit derived in Problem #1. If they are different, why is one of them higher than the other? (4 points) Problem 1 Emma Queen decided to open a food stand at the Bothell Friday Market at Beardslee Village. She planned to buy strawberries from her local farm and sell them at the Bothel Market on Fridays. She estimated cost of renting a truck to transport strawberries is $20.00 per week. The cost of strawberries to Emma is $0.90 per pound. Emma sold the strawberries on Friday between 10 am and 6 pm at the booth at the Farmer's Market. The booth rental is $40.00 per week. The strawberries are sold to the customers for $1.20 per pound. Strawberries not sold by 6 pm were discarded. Demand for strawberries was unpredictable, Queen estimated weekly demand before placing an order with the farmer and renting the truck to transport them. Based on demand from similar entrepreneurial ventures and interviews with potential customers, she estimated that weekly demand for the strawberries was normally distributed with a mean of 350 lbs and a standard deviation of 100 lbs. Problem 2 Queen came to believe after six months of operations that the demand for strawberries could be increased by wiping the strawberries and arranging them neatly in small wicker baskets. The demand was a function of the amount of time she invested in arranging the strawberries. Queen kept records of time she spent each week arranging the berries. Using this data, she derived the demand function: D= 350+avh= 350 where D is the weekly demand for the strawberries and h is the number of hours Queen spent arranging the strawberries in baskets. + 80 Vh As before, Queen forecast following week's demand every week based on the hours spend arranging the strawberries and used this demand forecast to determine her stocking quantity a. How many hours should Queen spend weekly in arranging the strawberries? Assume opportunity cost of her time to be $5.00 per hr. Try different values for h in the spreadsheet "Farmer's Market Strawberries Problem #2". Optimal stocking quantity Q is computed by the spreadsheet based on the newsvendor formula for your choice of h) (4 points) b. What explains Queen's choice of effort level h? (4 points) c. Compare the optimal profit under this scenario with the optimal profit derived in Problem #1. If they are different, why is one of them higher than the other? (4 points)Step by Step Solution
There are 3 Steps involved in it
1 Expert Approved Answer
Step: 1 Unlock

Question Has Been Solved by an Expert!
Get step-by-step solutions from verified subject matter experts
Step: 2 Unlock
Step: 3 Unlock