

Question: Please show your Excel formulas> Exercise 4_ch8_no1 (Descriptive statistics of two stocks): Here is the stock price history of High Tech and Low Tech corporations.
Please show your Excel formulas>
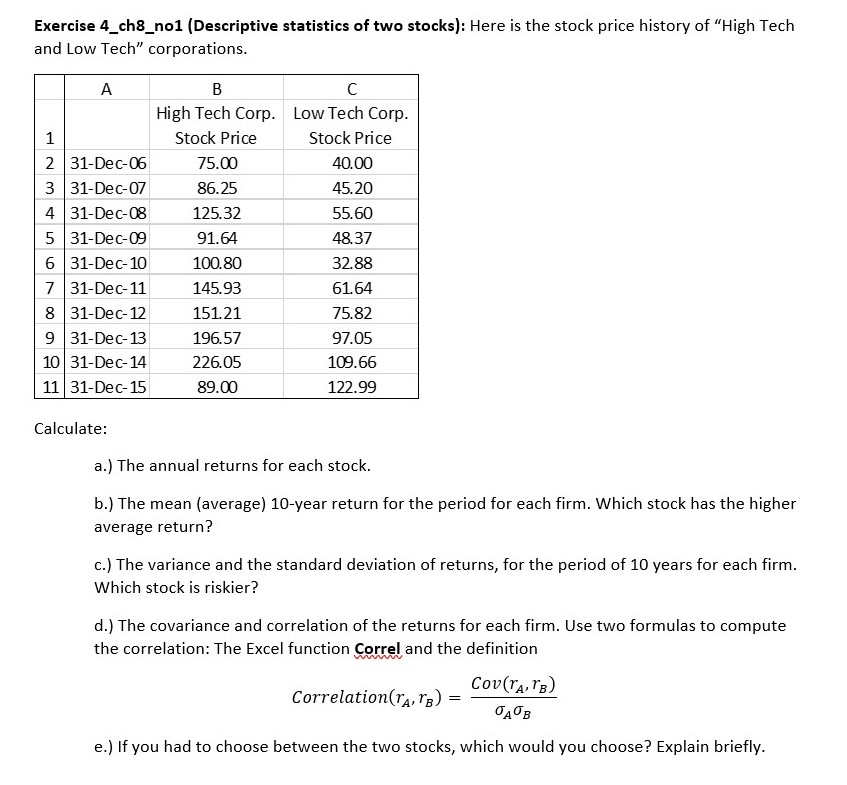
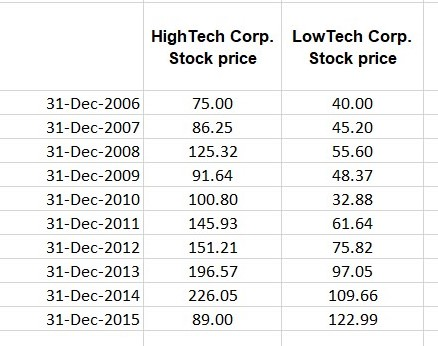
Exercise 4_ch8_no1 (Descriptive statistics of two stocks): Here is the stock price history of "High Tech and Low Tech" corporations. A 1 2 31-Dec-06 3 31-Dec-07 4 31-Dec-08 5 31-Dec-09 6 31-Dec-10 7 31-Dec-11 8 31-Dec-12 9 31-Dec-13 1031-Dec-14 11 31-Dec-15 B High Tech Corp. Low Tech Corp. Stock Price Stock Price 75.00 40.00 86.25 45.20 125.32 55.60 91.64 48.37 100.80 32.88 145.93 61.64 151.21 75.82 196.57 97.05 226.05 109.66 89.00 122.99 Calculate: a.) The annual returns for each stock. b.) The mean (average) 10-year return for the period for each firm. Which stock has the higher average return? c.) The variance and the standard deviation of returns, for the period of 10 years for each firm. Which stock is riskier? d.) The covariance and correlation of the returns for each firm. Use two formulas to compute the correlation: The Excel function Correl and the definition Cov(TA1B) Correlation(raro) = e.) If you had to choose between the two stocks, which would you choose? Explain briefly. High Tech Corp. Low Tech Corp. Stock price Stock price 31-Dec-2006 31-Dec-2007 31-Dec-2008 31-Dec-2009 31-Dec-2010 31-Dec-2011 31-Dec-2012 31-Dec-2013 31-Dec-2014 31-Dec-2015 75.00 86.25 125.32 91.64 100.80 145.93 151.21 196.57 40.00 45.20 55.60 48.37 32.88 61.64 75.82 97.05 109.66 122.99 226.05 89.00
Step by Step Solution
There are 3 Steps involved in it

Get step-by-step solutions from verified subject matter experts