

Question: Please show your solution in excel and explain it. Thanks The following table shows the demand for a certain product for eight quarters. Forecast the
 Please show your solution in excel and explain it. Thanks
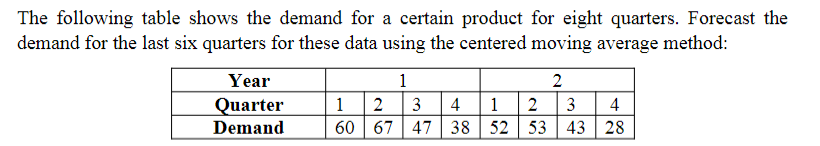
The following table shows the demand for a certain product for eight quarters. Forecast the demand for the last six quarters for these data using the centered moving average method
Step by Step Solution
There are 3 Steps involved in it
1 Expert Approved Answer
Step: 1 Unlock

Question Has Been Solved by an Expert!
Get step-by-step solutions from verified subject matter experts
Step: 2 Unlock
Step: 3 Unlock