Question: Please show your work including the formula used, associated assumptions, and the sources of values plugged in for the variables. Failure to show the work
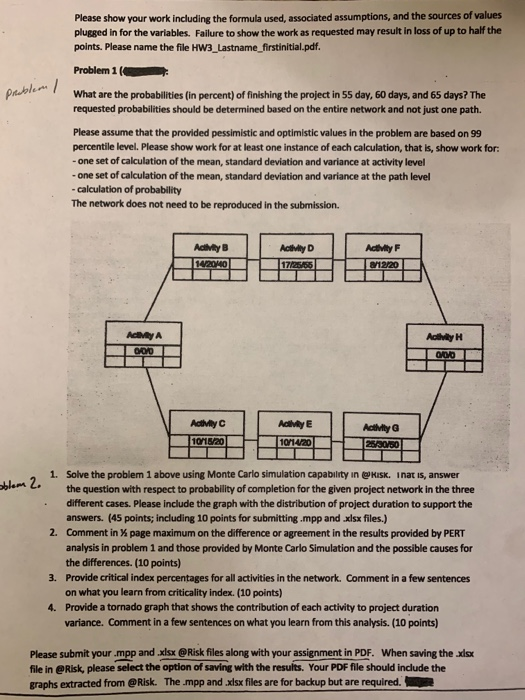
Please show your work including the formula used, associated assumptions, and the sources of values plugged in for the variables. Failure to show the work as requested may result in loss of up to half the points. Please name the file HW3 Lastname_firstinitial.pdf. Problem 1 problem What are the probabilities (in percent) of finishing the project in 55 day, 60 days, and 65 days? The requested probabilities should be determined based on the entire network and not just one path. Please assume that the provided pessimistic and optimistic values in the problem are based on 99 percentile level. Please show work for at least one instance of each calculation, that is, show won - one set of calculation of the mean, standard deviation and variance at activity level - one set of calculation of the mean, standard deviation and variance at the path level - calculation of probability The network does not need to be reproduced in the submission. AdB Activity D Activity F 1412040 17425351 8/12/201 Acthy 000 Acthy C 10/18/20H ActyEL 10/14/20 Activity G 25/30/50 1. Solve the problem 1 above using Monte Carlo simulation capability in @KISKinat is, answer oblem co oblem 2. the question with respect to probability of completion for the given project network in the three different cases. Please include the graph with the distribution of project duration to support the answers. (45 points; including 10 points for submitting.mpp and .xlsx files.) 2. Comment in x page maximum on the difference or agreement in the results provided by PERT analysis in problem 1 and those provided by Monte Carlo Simulation and the possible causes for the differences. (10 points) 3. Provide critical index percentages for all activities in the network. Comment in a few sentences on what you learn from criticality index. (10 points) 4. Provide a tornado graph that shows the contribution of each activity to project duration variance. Comment in a few sentences on what you learn from this analysis. (10 points) Please submit your .mpp and .xlsx @Risk files along with your assignment in PDF. When saving the .xdsx file in @Risk, please select the option of saving with the results. Your PDF file should include the graphs extracted from @Risk. The .mpp and .xlsx files are for backup but are required. Please show your work including the formula used, associated assumptions, and the sources of values plugged in for the variables. Failure to show the work as requested may result in loss of up to half the points. Please name the file HW3 Lastname_firstinitial.pdf. Problem 1 problem What are the probabilities (in percent) of finishing the project in 55 day, 60 days, and 65 days? The requested probabilities should be determined based on the entire network and not just one path. Please assume that the provided pessimistic and optimistic values in the problem are based on 99 percentile level. Please show work for at least one instance of each calculation, that is, show won - one set of calculation of the mean, standard deviation and variance at activity level - one set of calculation of the mean, standard deviation and variance at the path level - calculation of probability The network does not need to be reproduced in the submission. AdB Activity D Activity F 1412040 17425351 8/12/201 Acthy 000 Acthy C 10/18/20H ActyEL 10/14/20 Activity G 25/30/50 1. Solve the problem 1 above using Monte Carlo simulation capability in @KISKinat is, answer oblem co oblem 2. the question with respect to probability of completion for the given project network in the three different cases. Please include the graph with the distribution of project duration to support the answers. (45 points; including 10 points for submitting.mpp and .xlsx files.) 2. Comment in x page maximum on the difference or agreement in the results provided by PERT analysis in problem 1 and those provided by Monte Carlo Simulation and the possible causes for the differences. (10 points) 3. Provide critical index percentages for all activities in the network. Comment in a few sentences on what you learn from criticality index. (10 points) 4. Provide a tornado graph that shows the contribution of each activity to project duration variance. Comment in a few sentences on what you learn from this analysis. (10 points) Please submit your .mpp and .xlsx @Risk files along with your assignment in PDF. When saving the .xdsx file in @Risk, please select the option of saving with the results. Your PDF file should include the graphs extracted from @Risk. The .mpp and .xlsx files are for backup but are required