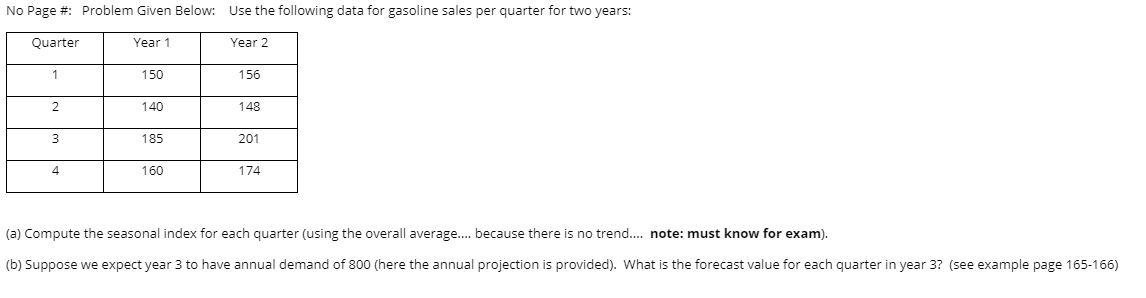
Question: Please show your work. No Page #: Problem Given Below: Use the following data for gasoline sales per quarter for two years: Quarter Year 1

Please show your work. No Page #: Problem GivenPlease show your work.

No Page #: Problem Given Below: Use the following data for gasoline sales per quarter for two years: Quarter Year 1 Year 2 1 150 156 2 140 148 3 185 201 4 160 174 (a) Compute the seasonal index for each quarter (using the overall average.... because there is no trend.... note: must know for exam). (b) Suppose we expect year 3 to have annual demand of 800 (here the annual projection is provided). What is the forecast value for each quarter in year 3? (see example page 165-166)

Step by Step Solution

There are 3 Steps involved in it

1 Expert Approved Answer
Step: 1 Unlock blur-text-image
Question Has Been Solved by an Expert!

Get step-by-step solutions from verified subject matter experts

Step: 2 Unlock
Step: 3 Unlock

Students Have Also Explored These Related General Management Questions!