

Question: please show your work, Thank you! 5. A study was conducted to investigate the growth characteristics of blue mussel in New South Wales. Samples were
please show your work, Thank you!
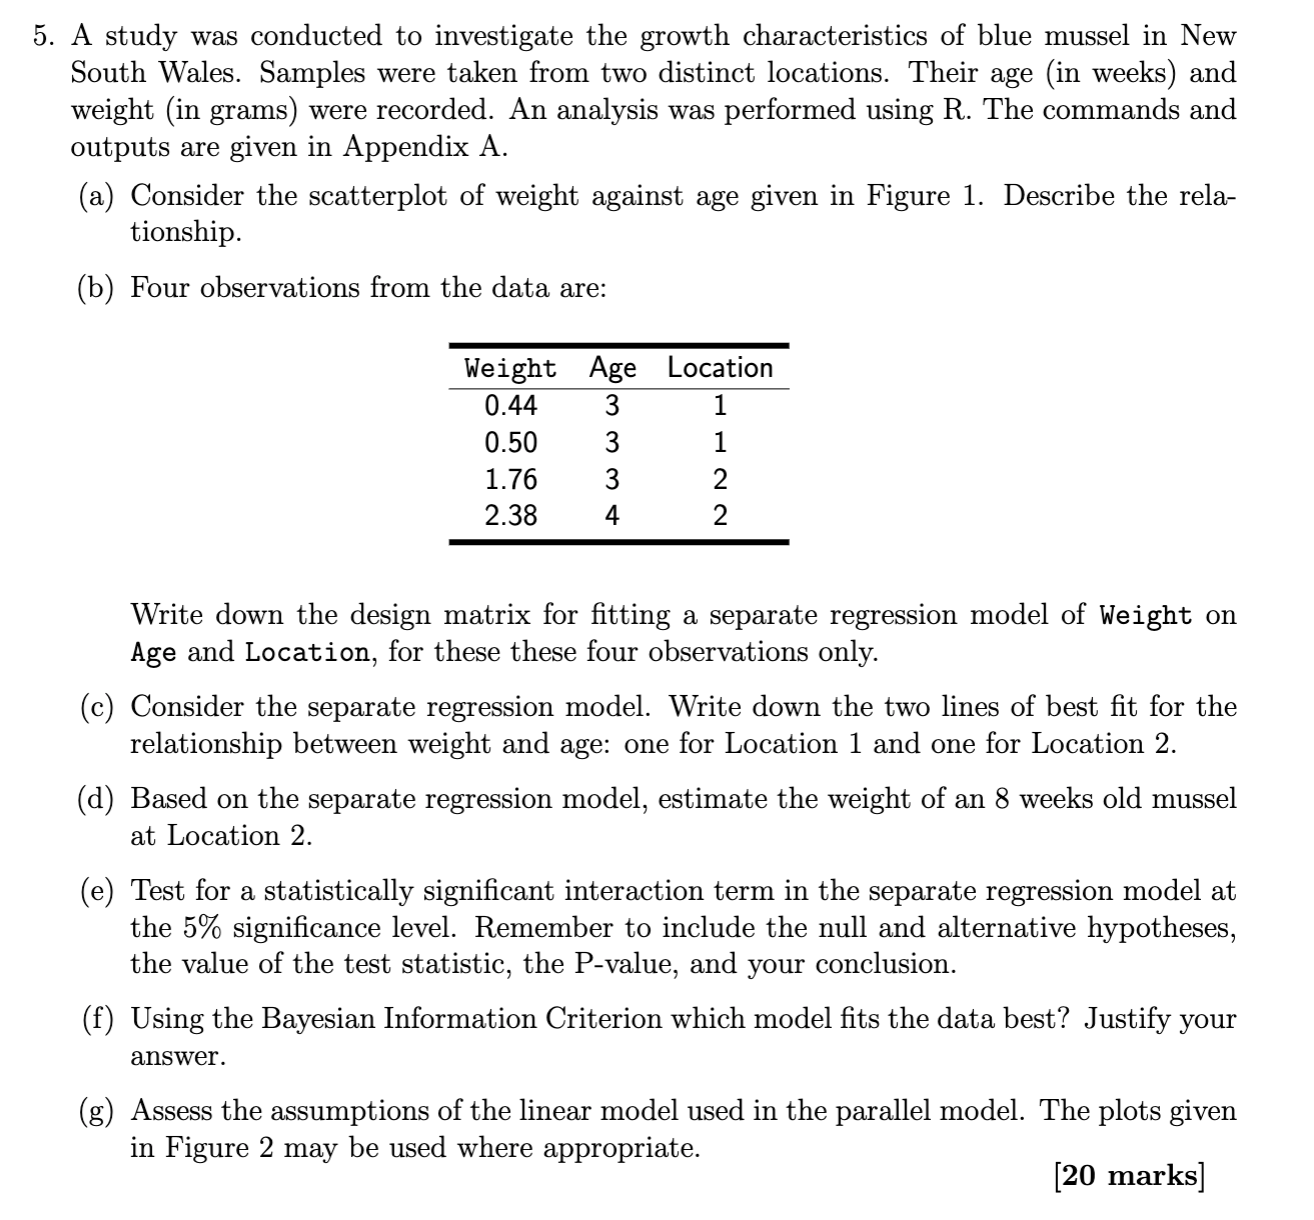
5. A study was conducted to investigate the growth characteristics of blue mussel in New South Wales. Samples were taken from two distinct locations. Their age (in weeks) and weight (in grams) were recorded. An analysis was performed using R. The commands and outputs are given in Appendix A. (a) Consider the scatterplot of weight against age given in Figure 1. Describe the rela tionship. (b) Four observations from the data are: We ight Age Location 0.44 3 1 0.50 3 1 1.76 3 2 2.38 4 2 Write down the design matrix for tting a separate regression model of Weight on Age and Location, for these these four observations only. (c) Consider the separate regression model. Write down the two lines of best t for the relationship between weight and age: one for Location 1 and one for Location 2. (d) Based on the separate regression model, estimate the weight of an 8 weeks old mussel at Location 2. (e) Test for a statistically signicant interaction term in the separate regression model at the 5% signicance level. Remember to include the null and alternative hypotheses, the value of the test statistic, the P-value, and your conclusion. (f) Using the Bayesian Information Criterion which model ts the data best? Justify your answer. (g) Assess the assumptions of the linear model used in the parallel model. The plots given in Figure 2 may be used where appropriate. [20 marks]
Step by Step Solution
There are 3 Steps involved in it

Get step-by-step solutions from verified subject matter experts