

Question: Please show your work, thank you! Consider the data in the table collected from three independent Sample 1 Sample 2 Sample 3 populations. 5 1
Please show your work, thank you!
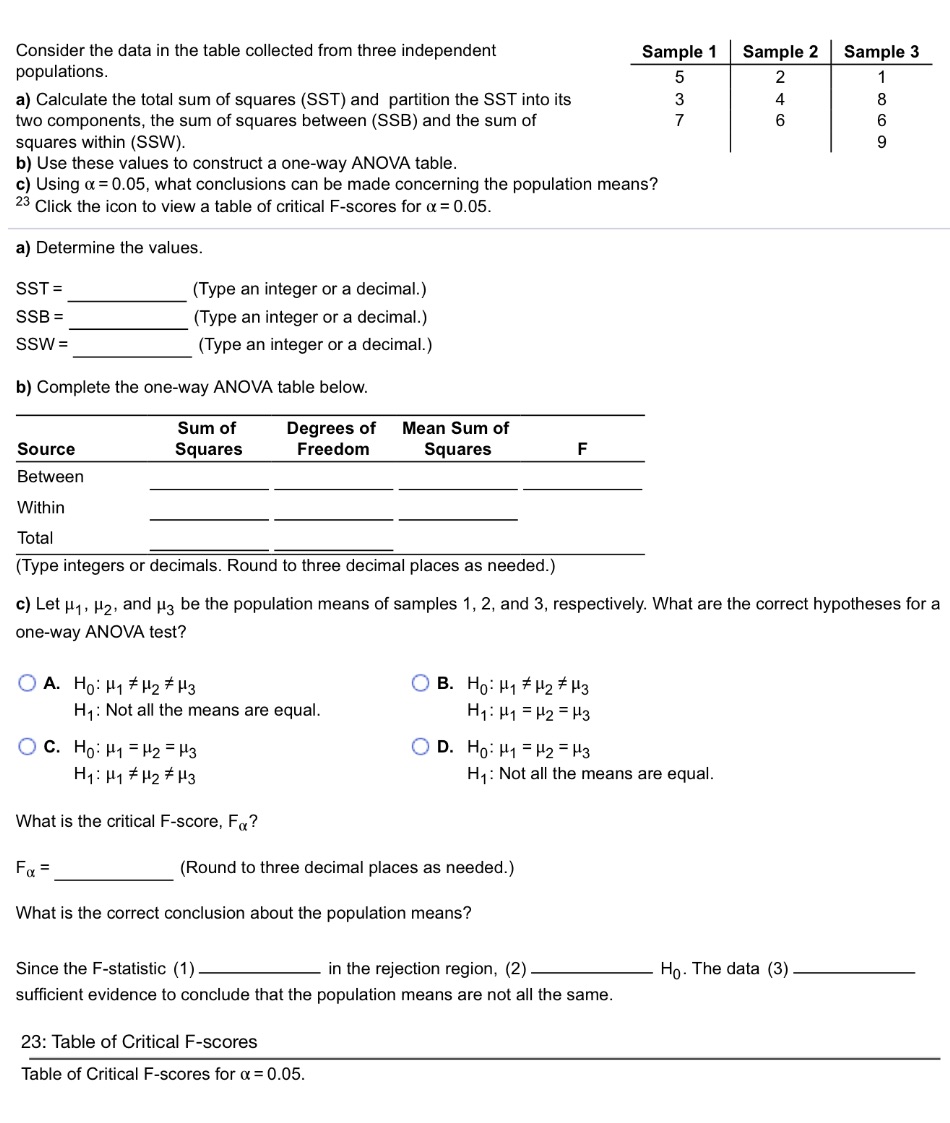
Consider the data in the table collected from three independent Sample 1 Sample 2 Sample 3 populations. 5 1 a) Calculate the total sum of squares (SST) and partition the SST into its 3 8 two components. the sum of squares between (333) and the sum of 7 6 squares within {SSW}. 9 b) Use these values to construct a one-way ANOVA table. c] Using a = l0.05. what conclusions can be made concerning the population means? 23 Click the icon to view a table of critical F-scores for t: = 0.05. a) Determine the values. SST = [Type an integer or a decimal.) 383 = {Type an integer or a decimal.) SSW = (Type an integer or a decimal.) b) Complete the one-way.r ANOVA table below. Sum of Degrees of lillean Sum of Scurce Squares Freedom Squares F Between Within Total (Type integers or decimals. Round to three decimal places as needed.) c) Let H, [12, and 143 be the population means of samples 1, 2, and 3. respectively. What are the correct hypotheses for a one-way ANOVA test? 0A. H0:p1p2#p3 OB. chp1ip2p3 H1: Not all the means are equal. H1: p1 = '12 = [.13 Oc- H03P1=H2=P3 09-H01H1=P2=|43 H1: p1 a pg 5'5 p3 H1: Not all the means are equal. What is the critical F-score. F\"? F\" = (Round to three decimal places as needed.) What is the correct conclusion about the population means? Since the F-statistic (1) in the rejection region, (2) H0. The data (3) sufcient evidence to conclude that the population means are not all the same. 23: Table of Critical F-sccres Table of Critical F-scores for u = 0.05
Step by Step Solution
There are 3 Steps involved in it

Get step-by-step solutions from verified subject matter experts