

Question: Sample Sample Sample Sample 4 2 3 Consider the data in the table collected from four independent populations. 19 17 18 a) Calculate the total
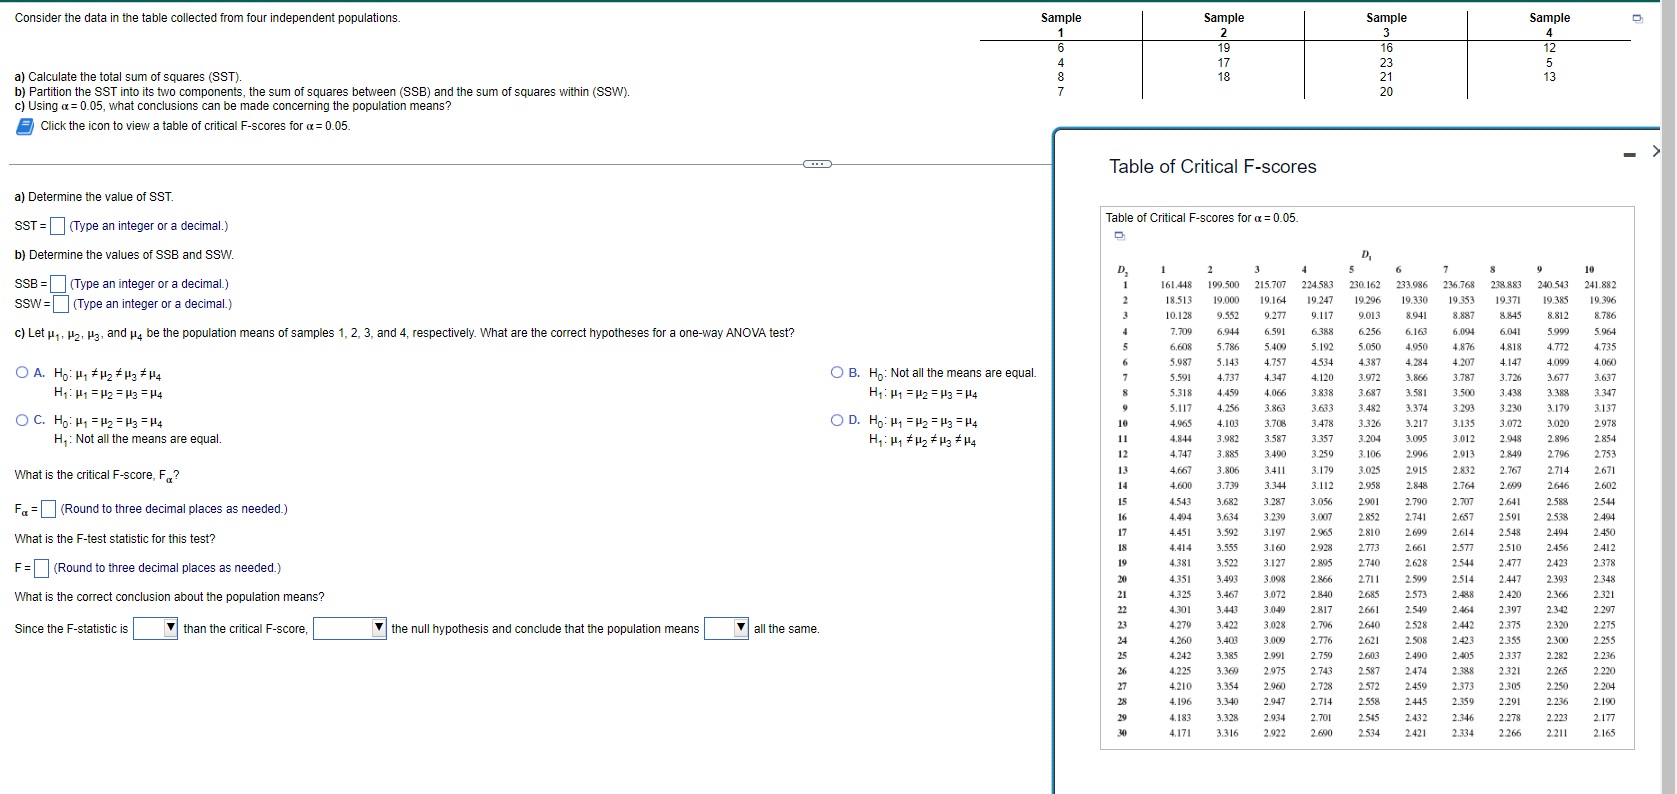
Sample Sample Sample Sample 4 2 3 Consider the data in the table collected from four independent populations. 19 17 18 a) Calculate the total sum of squares (SST). b) Partition the SST into its two components, the sum of squares between (SSB) and the sum of squares within (SSW). c) Using a = 0.05, what conclusions can be made concerning the population means? Click the icon to view a table of critical F-scores for a = 0.05. Table of Critical F-scores Table of Critical F-scores for a = 0.05. a) Determine the value of SST. D. SST = (Type an integer or a decimal.) 10 5 233.986 236.768 238.883 240.543 241.882 b) Determine the values of SSB and SSW. 161.448 199.500 215.707 224.583 230.162 19.296 19,330 19.353 19.371 19.385 19.396 18.513 19,000 19,16 19.247 8.786 9.117 9.01 8.94 8.887 B.845 8.812 SSB = (Type an integer or a decimal.) 10.128 9.552 9.277 6.16 6.094 6.041 5.999 5.964 7.709 6.94 5.591 6.388 5.256 SSW=(Type an integer or a decimal.) 772 4.735 5,786 5.40 5.050 1030 1816 1818 6.60 5.192 4387 A 28 1 147 100 4 060 c) Let H1, H2, Ha, and u4 be the population means of samples 1, 2, 3, and 4, respectively. What are the correct hypotheses for a one-way ANOVA test? 5.08 3.143 1 75 4534 3.72 3.677 3.637 O B. Ho: Not all the means are equal. 5.591 4.737 1.34 4.120 3.972 3.866 3.787 3.388 3.347 4.459 1.06 3.838 3.687 3.58 3.500 3.438 5.318 3.17 3.633 3.482 3.374 3.230 O A. HO: H1 # H2 # Hg # H4 H1: 11 = H2 = H3 = H4 3.293 3.137 5.117 1 256 3.86 3.217 3.135 3.07 3.020 2978 H1: H1 = H2 = H3 = H4 4.965 4.10 3.70 3.478 3.326 O D. Ho: H1 = H2 = M3 = H4 3.20 3.09 3.012 2.948 2.896 2.854 4.84 3.98 3.58 3.357 2753 H1: Hy # H2 * H3 # H4 3.490 3.259 3.106 2.096 2.913 284 2.796 O C. Ho: H1 = H2 = M3 = H4 4,747 1.88 2.832 2.76 2714 2671 2915 H, : Not all the means are equal. 4.66 3,806 341 3.179 3.025 3.34 3.112 2.958 2.848 2.764 2.69 2.646 2.602 4.600 3.73 2.544 3.287 3.056 2.901 2.790 2.707 2.641 2.588 4.543 3.68 2 494 What is the critical F-score, Fo? 3.239 3.007 2852 2.741 2.657 2.591 2.538 3.634 2.548 2.494 2 450 3.59 3.197 2.965 2.810 2.690 2.614 2456 2412 Fa = (Round to three decimal places as needed.) 3.55 3.16 2.928 2.773 2.66 2.577 2.510 4.414 2.544 2.477 2423 2378 4.381 .522 3.12 2 893 2740 2.62 2 303 2 348 What is the F-test statistic for this test? 3.40 3.098 2711 2 509 2.447 .35 2 866 2.514 2.573 2.488 2.42 2.366 2.321 F=(Round to three decimal places as needed.) .325 3.467 3.072 2.840 2.685 2.817 2.661 2.54 2.464 2.397 2.342 2.297 .301 3.44 3.049 2.528 2.442 2.375 2.320 2.275 1.279 .422 3.028 2.796 2.640 What is the correct conclusion about the population means? 2.50 2.423 2.355 2.300 2.255 2621 all the same. 4.260 3.40 3.009 2 776 2.490 2.405 2.337 2.282 2.236 2.991 2 759 2.603 Since the F-statistic is than the critical F-score, the null hypothesis and conclude that the population means 4.242 3.38 2.587 2.474 2.388 2.321 2.265 2.220 4.225 3.36 2.975 743 2 728 2.572 2459 2.373 2.305 2.250 2.204 4.210 3.35 2.960 2.190 4.196 3.34 2.947 2.714 2.558 2.445 2.359 2,291 2.236 2.278 3.328 2.934 2.545 2.432 2.346 2.223 2.177 4.183 2.701 2.334 2.266 2.211 2.165 4,171 3.316 2.922 2.690 2.534 2.421
Step by Step Solution
There are 3 Steps involved in it

Get step-by-step solutions from verified subject matter experts