

Question: please solution by excel Task 2 (25 mins) 1- If marks of 20 students in one class out of 100 were as the following (Screen
please solution by excel
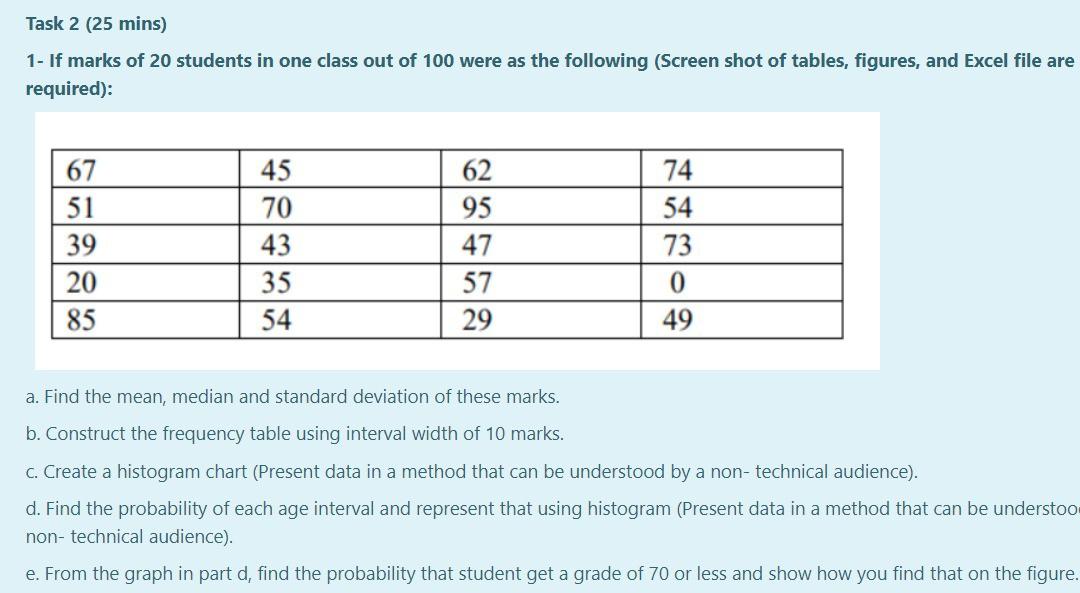
Task 2 (25 mins) 1- If marks of 20 students in one class out of 100 were as the following (Screen shot of tables, figures, and Excel file are required): 67 51 39 20 85 45 70 43 35 54 62 95 47 57 29 74 54 73 0 49 a. Find the mean, median and standard deviation of these marks. b. Construct the frequency table using interval width of 10 marks. C. Create a histogram chart (Present data in a method that can be understood by a non- technical audience). d. Find the probability of each age interval and represent that using histogram (Present data in a method that can be understoo non- technical audience). e. From the graph in part d, find the probability that student get a grade of 70 or less and show how you find that on the figure
Step by Step Solution
There are 3 Steps involved in it

Get step-by-step solutions from verified subject matter experts