

Question: Please solve 1. The following stem-and-leaf chart shows the number of units produced per day in a factory. Stem Leaf W 8 6 0133559 0236778
Please solve
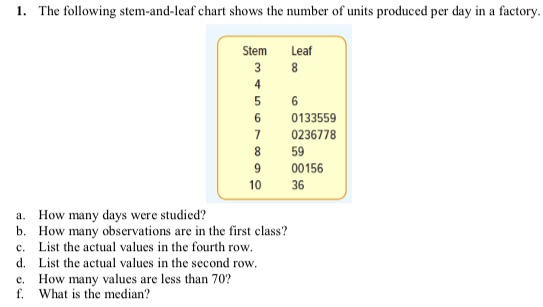
1. The following stem-and-leaf chart shows the number of units produced per day in a factory. Stem Leaf W 8 6 0133559 0236778 59 00156 10 36 a. How many days were studied? b. How many observations are in the first class? c. List the actual values in the fourth row. d. List the actual values in the second row. c. How many values are less than 70? What is the median
Step by Step Solution
There are 3 Steps involved in it
1 Expert Approved Answer
Step: 1 Unlock

Question Has Been Solved by an Expert!
Get step-by-step solutions from verified subject matter experts
Step: 2 Unlock
Step: 3 Unlock