

The following stem-and-leaf chart shows the number of units produced per day in a factory: a.?How many
Question:
The following stem-and-leaf chart shows the number of units produced per day in a factory: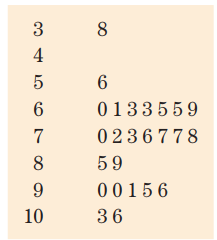
a.?How many days were studied?b.?How many observations are in the first class?c.?What are the smallest and the largest values?d.?List the actual values in the fourth row.e.?List the actual values in the second row.f.?How many values are less than 70?g.?How many values are 80 or more?h.?What is the middle value?i.?How many values are between 60 and 89, inclusive?
Fantastic news! We've Found the answer you've been seeking!
Step by Step Answer:
a 25 b 1 c 38 ...View the full answer

Answered By
ALI KHAN
I have just completed my Masters degree in Physics and have a some experience of teaching also. I have skills of solving problems within less time.
0 Reviews
10+ Question Solved
Related Book For 
Basic Statistics For Business & Economics
ISBN: 9781259268939
6th Canadian Edition
Authors: Douglas A. Lind, William G Marchal, Samuel A. Wathen, Carol Ann Waite
Question Posted:
