

Question: Please solve 2 explaining the code used in Juypiter Lab Question 2. (20 pts) The following graphs show the monthly average temperature (low and high)
Please solve 2 explaining the code used in Juypiter Lab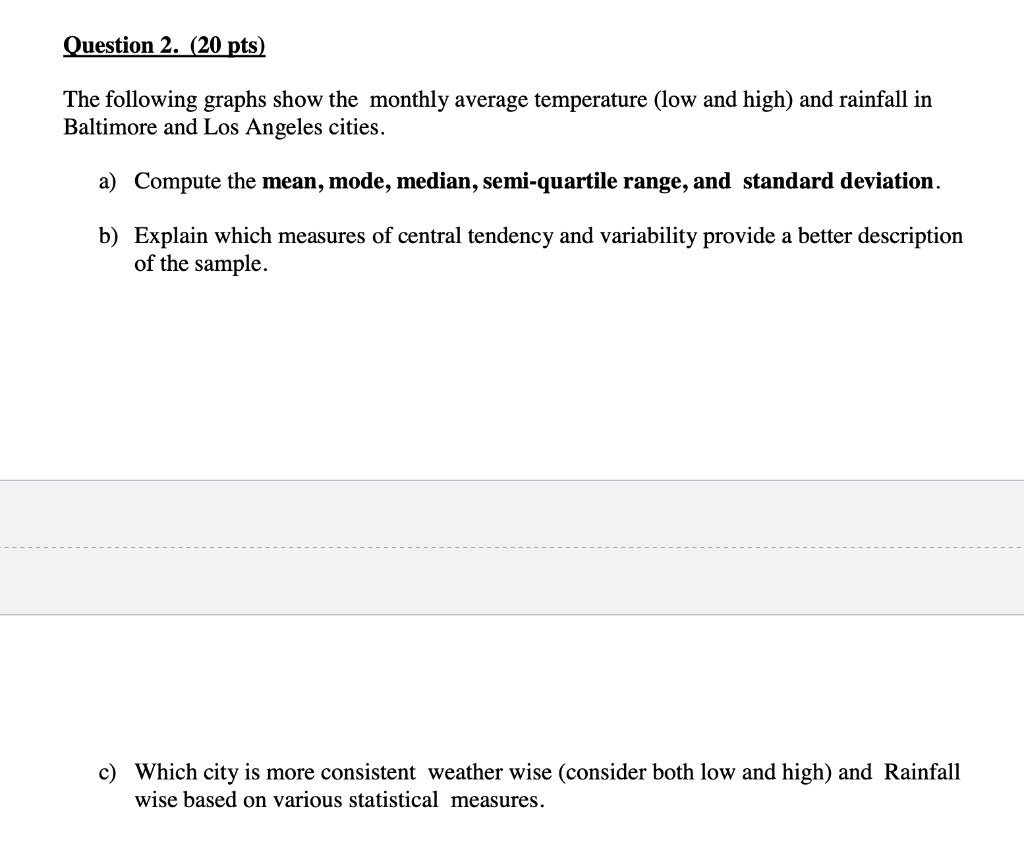
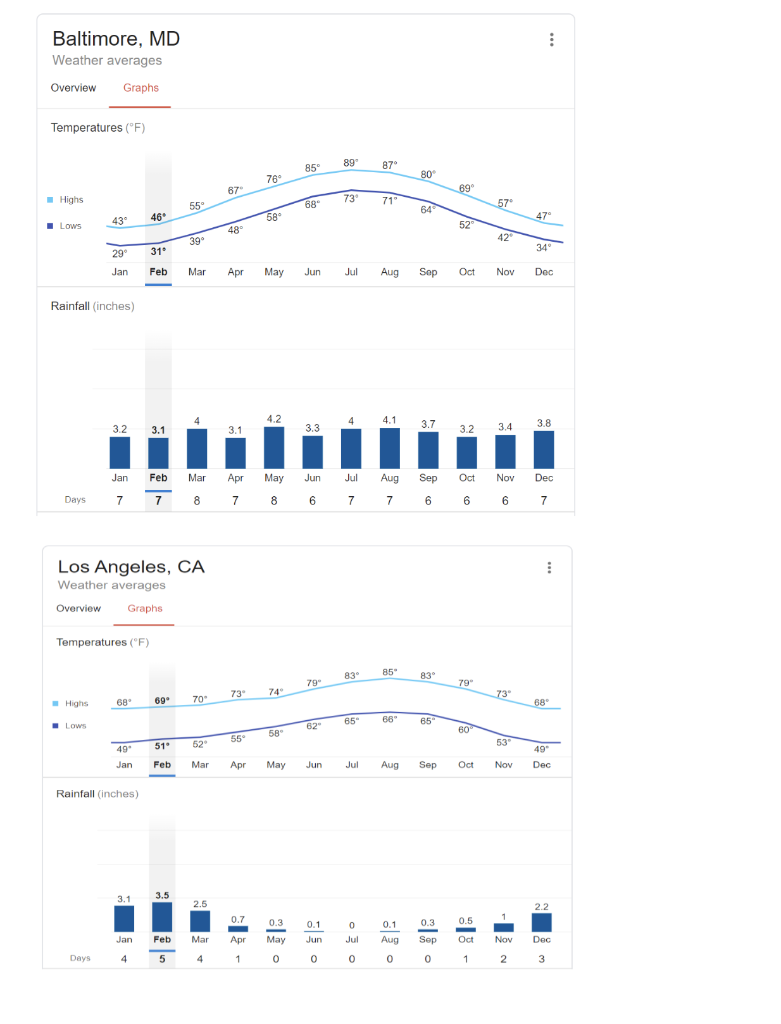
Question 2. (20 pts) The following graphs show the monthly average temperature (low and high) and rainfall in Baltimore and Los Angeles cities. a) Compute the mean, mode, median, semi-quartile range, and standard deviation. b) Explain which measures of central tendency and variability provide a better description of the sample. c) Which city is more consistent weather wise (consider both low and high) and Rainfall wise based on various statistical measures. Baltimore, MD Weather averages Overview Graphs Temperatures (F) 85 8589987 76 Highs 67 Lows 839466 5 37 3948586878 Jan Feb Mar Apr May Jun Jul Aug Sep Oct Nov Dec Rainfall (inches) 4 4.2 4 32 4. 1 3 .7 3.1 3.4 3.8 Days Jan 7 Feb 7 Mar 8 Apr 7 May 8 Jun 6 Jul 7 Aug 7 Sep 6 Oct 6 Nov 6 Dec 7 Los Angeles, CA Weather averages Overview Graphs Temperatures (F) 83 8583 03797388 70 73 74 Highs 68 69 B2 Low's 65 66" 85" 49 51 52 55 58 5349" Nov Dec Jan Feb Mar Apr May Jun Jul Aug Sep Oct Rainfall (inches) 3.1 3.5 0.7 0.1 0.3 0. 5 1 Jan 4 Feb 5 Mar 4 Days 0.3 May 0 Apr 1 0.1 Jun 0 0 Jul 0 Aug 0 Sep 0 Oct 1 Nov 2 Dec 3 Question 2. (20 pts) The following graphs show the monthly average temperature (low and high) and rainfall in Baltimore and Los Angeles cities. a) Compute the mean, mode, median, semi-quartile range, and standard deviation. b) Explain which measures of central tendency and variability provide a better description of the sample. c) Which city is more consistent weather wise (consider both low and high) and Rainfall wise based on various statistical measures. Baltimore, MD Weather averages Overview Graphs Temperatures (F) 85 8589987 76 Highs 67 Lows 839466 5 37 3948586878 Jan Feb Mar Apr May Jun Jul Aug Sep Oct Nov Dec Rainfall (inches) 4 4.2 4 32 4. 1 3 .7 3.1 3.4 3.8 Days Jan 7 Feb 7 Mar 8 Apr 7 May 8 Jun 6 Jul 7 Aug 7 Sep 6 Oct 6 Nov 6 Dec 7 Los Angeles, CA Weather averages Overview Graphs Temperatures (F) 83 8583 03797388 70 73 74 Highs 68 69 B2 Low's 65 66" 85" 49 51 52 55 58 5349" Nov Dec Jan Feb Mar Apr May Jun Jul Aug Sep Oct Rainfall (inches) 3.1 3.5 0.7 0.1 0.3 0. 5 1 Jan 4 Feb 5 Mar 4 Days 0.3 May 0 Apr 1 0.1 Jun 0 0 Jul 0 Aug 0 Sep 0 Oct 1 Nov 2 Dec 3
Step by Step Solution
There are 3 Steps involved in it

Get step-by-step solutions from verified subject matter experts