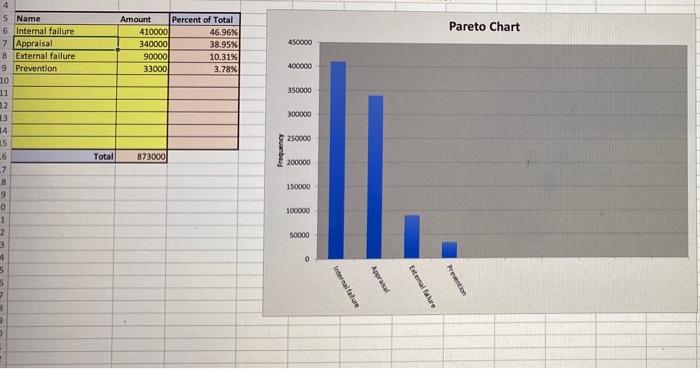
Question: Please solve: 4 Pareto Chart 5 Name 6 Internal failure 7 Appraisal 8 External failure 9 Prevention 10 11 12 Amount Percent of Total 410000

Please solve:
Please solve: 4 Pareto Chart 5 Name 6 Internal
4 Pareto Chart 5 Name 6 Internal failure 7 Appraisal 8 External failure 9 Prevention 10 11 12 Amount Percent of Total 410000 46.96% 340000 38.95% 90000 10.31% 33000 3.78% 450000 400000 350000 300000 250000 Total 873000 Frequency 200000 150000 14 15 .6 -7 8 9 0 1 2 3 1 300000 50000 0 5 7 3 Internal failure Appraisal External lure Prevention 3 Analysis of customer complaints at an e-commerce retailer revealed the following: Billing errors: 1,598 Shipping errors: 948 Electronic charge errors: 651 Shipping delays: 2,702 Packing errors: 1,740 The data has been sorted for your convenience. Calculate the percent of total complaints for each category of errors. Round your answers to two decimal places Name Amount Percent of Total Shipping delays 2,702 Packing errors 1,740 Billing errors 1,598 % Shipping errors 948 96 Electronic charge errors 651 Use the Excel Pareto template to construct a Pareto chart and choose the correct Pareto diagram The correct Pareto diagram is chart A A. Frequency 4000 3000 2000 1000 Shipping delays Packing errors Billing errors Shipping errors Electronic charge errors

Step by Step Solution

There are 3 Steps involved in it

1 Expert Approved Answer
Step: 1 Unlock blur-text-image
Question Has Been Solved by an Expert!

Get step-by-step solutions from verified subject matter experts

Step: 2 Unlock
Step: 3 Unlock

Students Have Also Explored These Related General Management Questions!