

Question: Please solve 8. [-/5.31 Points] DETAILS BBUNDERSTAT12 9.2.014.NVA MY NOTES ASK YOUR TEACHER Does prison really deter violent crime? Let x represent percent change in
Please solve
![Please solve 8. [-/5.31 Points] DETAILS BBUNDERSTAT12 9.2.014.NVA MY NOTES ASK YOUR](https://dsd5zvtm8ll6.cloudfront.net/si.experts.images/questions/2024/10/670913e4a68b0_164670913e482c4e.jpg)
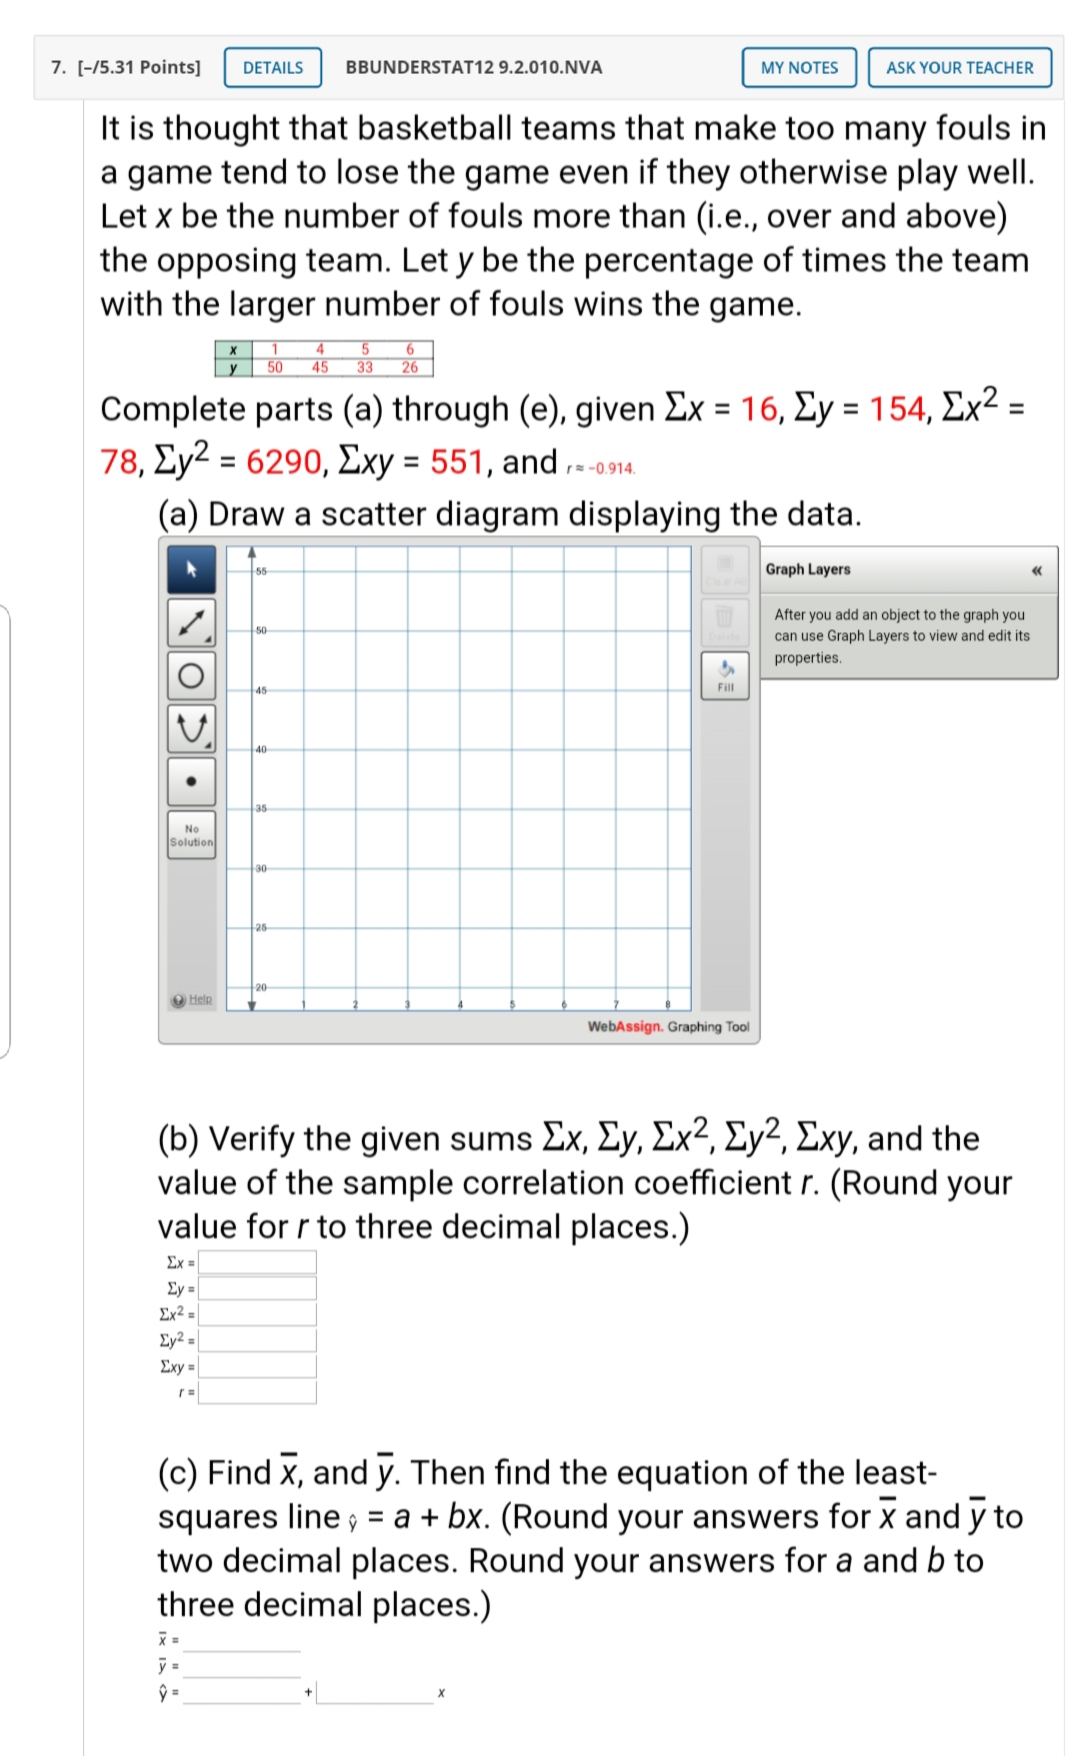
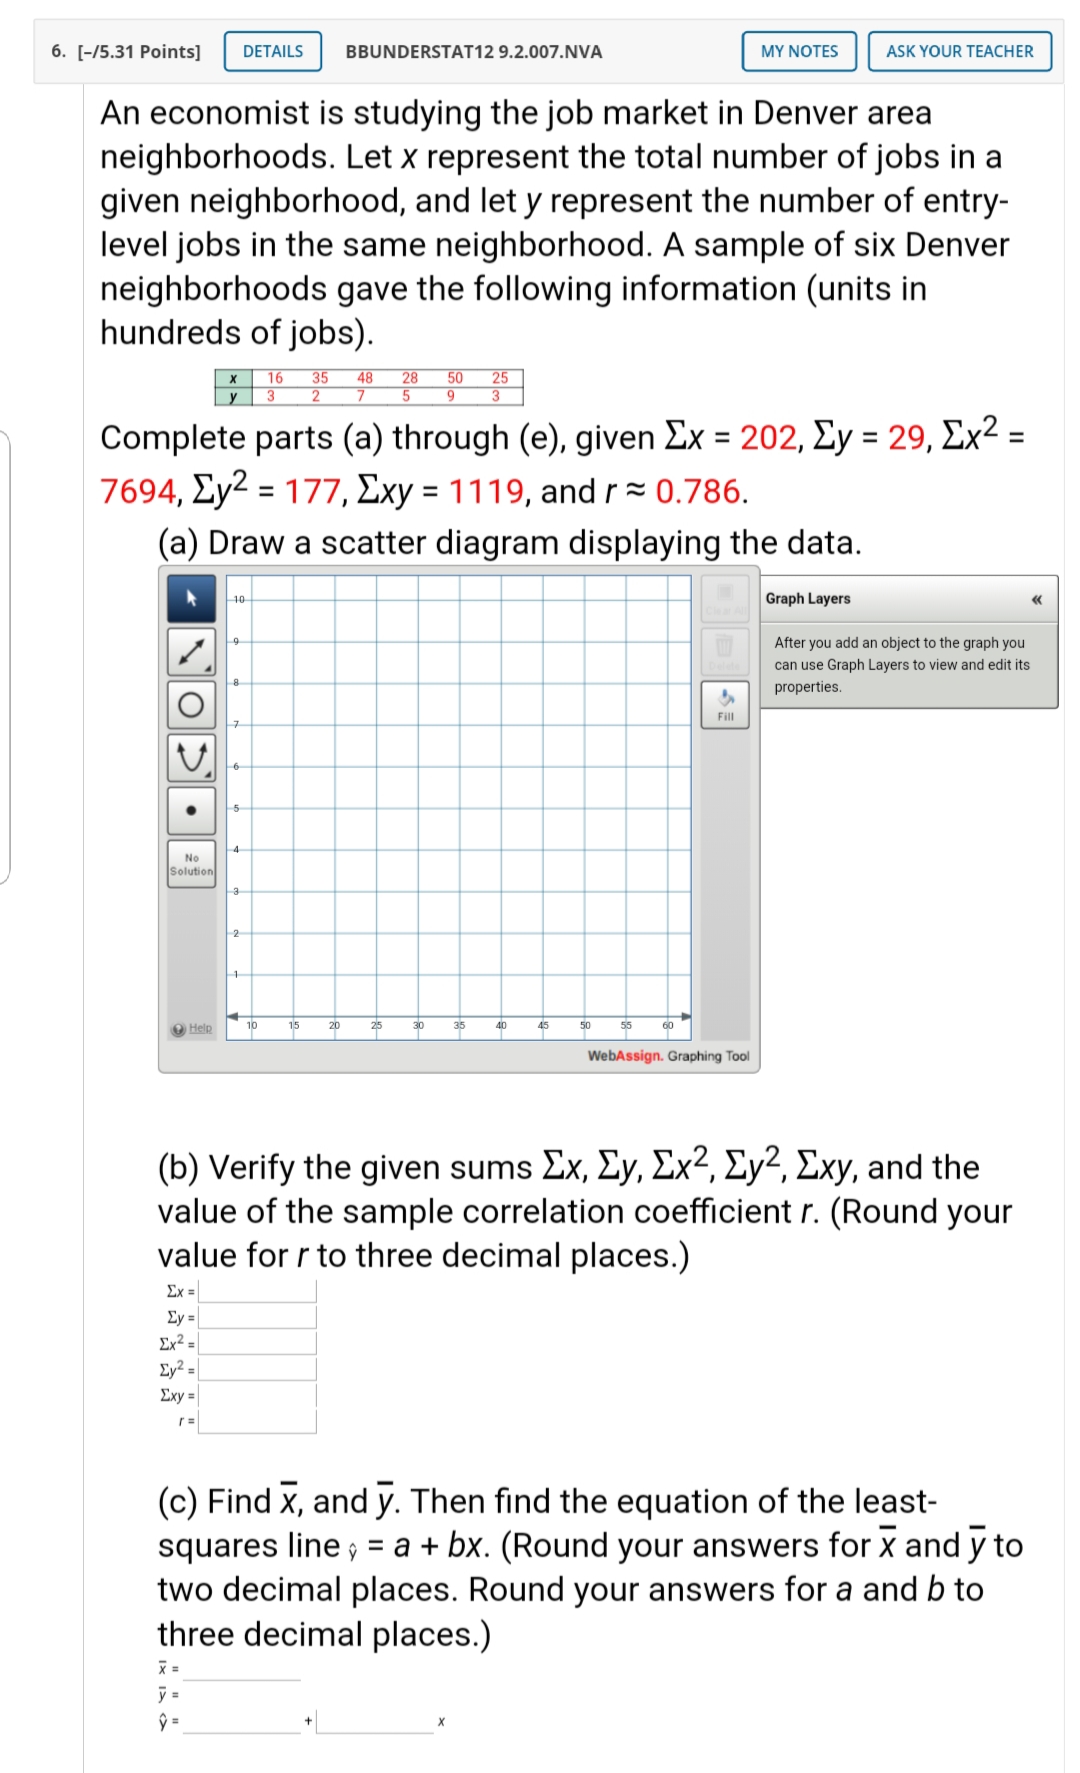
8. [-/5.31 Points] DETAILS BBUNDERSTAT12 9.2.014.NVA MY NOTES ASK YOUR TEACHER Does prison really deter violent crime? Let x represent percent change in the rate of violent crime and y represent percent change in the rate of imprisonment in the general U.S. population. For 7 recent years, the following data have been obtained. 3.7 5 .2 6.2 6.5 11.1 Complete parts (a) through (e), given Ex = 44.8, zy- -16.7, Ex2 = 317.84, Zy2 = 109.91, Exy= -103.7, and r ~ 0.068. (a) Draw a scatter diagram displaying the data. Graph Layers After you add an object to the graph you can use Graph Layers to view and edit its O properties. Fill V No Solution Help WebAssign. Graphing Tool (b) Verify the given sums Ex, Zy, Ex2, Zy2, Exy, and the value of the sample correlation coefficient r. (Round your value for r to three decimal places.) Ex = Ey = Ex2 = Ey? = Exy (c) Find x, and y. Then find the equation of the least- squares line , = a + bx. (Round your answers for x and y to two decimal places. Round your answers for a and b to three decimal places.) X = y = 9 =7. [-/5.31 Points] DETAILS BBUNDERSTAT12 9.2.010.NVA MY NOTES ASK YOUR TEACHER It is thought that basketball teams that make too many fouls in a game tend to lose the game even if they otherwise play well. Let x be the number of fouls more than (i.e., over and above) the opposing team. Let y be the percentage of times the team with the larger number of fouls wins the game. Complete parts (a) through (e), given Ex = 16, Zy = 154, Ex2 = 78, Ey2 = 6290, Exy = 551, and - -0.914. (a) Draw a scatter diagram displaying the data. Graph Layers After you add an object to the graph you can use Graph Layers to view and edit its properties. O Fill V No Solution 20 Help WebAssign. Graphing Tool (b) Verify the given sums Ex, Zy, Ex2, Zy2, Exy, and the value of the sample correlation coefficient r. (Round your value for r to three decimal places.) Ex = Zy = Ex2 = Ey2 = Exy = 1 = (c) Find x, and y. Then find the equation of the least- squares line , = a + bx. (Round your answers for x and y to two decimal places. Round your answers for a and b to three decimal places.) X = y = Q =An economist is studying the job market in Denver area neighborhoods. Let x represent the total number ofjobs in a given neighborhood, and let y represent the number of entry- level jobs in the same neighborhood. A sample of six Denver neighborhoods gave the following information (units in hundreds of jobs). [.15 35 4a 23 so 25 n3 2 ? 5 9 3 Complete parts (a) through (e). given Ex = 202, y = 29, 2x2 = 7694, Eyz = 177, Exy = 1119, and r = 0.786. (a) Draw a scatter diagram displaying the data. L "' Anuwu-ddmohioumunmhnu ununcmhummmanddlliu proportion. HERE 3 i? s W D (b) Verify the given sums Ex. 2y, 2x2, Zyz, ny, and the value of the sample correlation coefficient r. (Round your value for r to three decimal places.) I | l 2,34 l ' I | (c) Find Z and 37. Then nd the equation of the least- squares line 9 = a + bx. (Round your answers for E and )7 to two decimal places. Round your answers for a and b to three decimal places.) 1: is S}: 1" x
Step by Step Solution
There are 3 Steps involved in it

Get step-by-step solutions from verified subject matter experts