

Question: Please solve a and b The data table to the right represents the volumes of a generic soda brand. Volumes of soda (oz) Complete parts
Please solve a and b
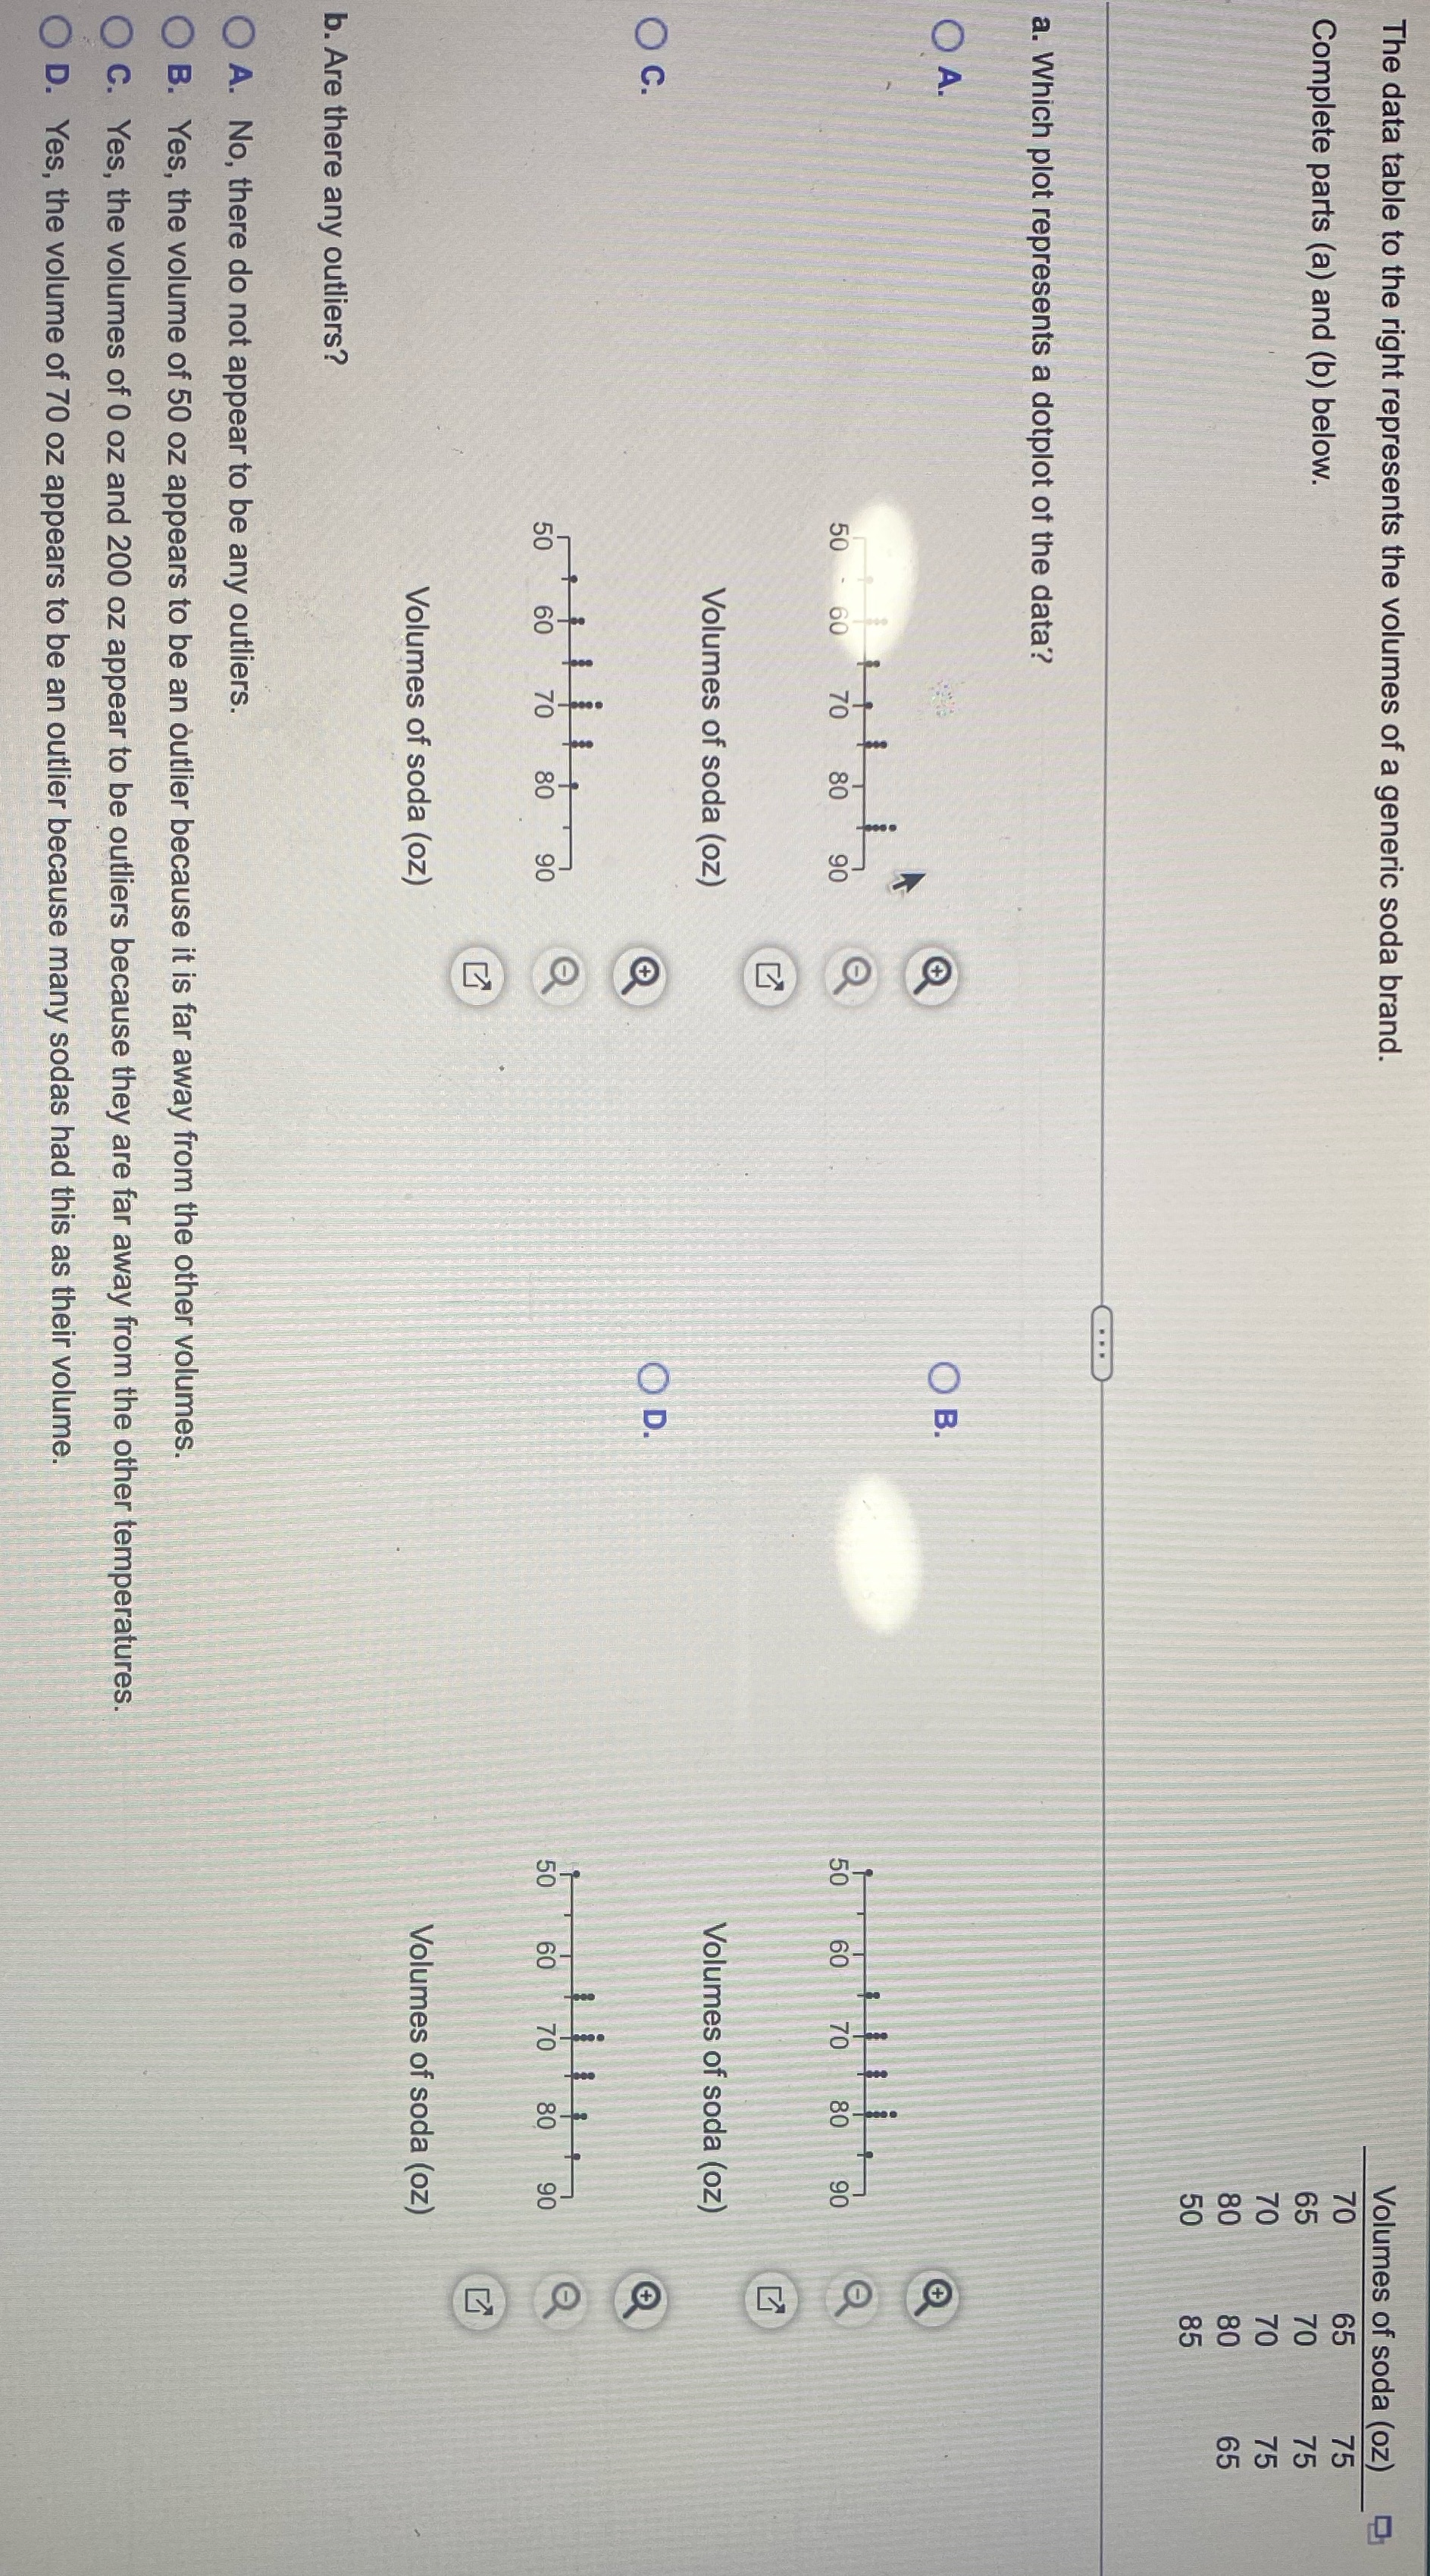
The data table to the right represents the volumes of a generic soda brand. Volumes of soda (oz) Complete parts (a) and (b) below. a. Which plot represents a dotplot of the data? O A. O B. 50 70 80 8 60 70 80 Volumes of soda (oz) Volumes of soda (oz) O C. OD. 50 60 70 80 90 O 50 60 70 80 90 17 Volumes of soda (oz) Volumes of soda (oz) b. Are there any outliers ? A. No, there do not appear to be any outliers. B. Yes, the volume of 50 oz appears to be an outlier because it is far away from the other volumes. O C. Yes, the volumes of 0 oz and 200 oz appear to be outliers because they are far away from the other temperatures. O D. Yes, the volume of 70 oz appears to be an outlier because many sodas had this as their volume
Step by Step Solution
There are 3 Steps involved in it

Get step-by-step solutions from verified subject matter experts