

Question: Please solve A financial analyst is examining the relationship between stock prices and earnings per share. She chooses sixteen publicly traded companies at random and
Please solve
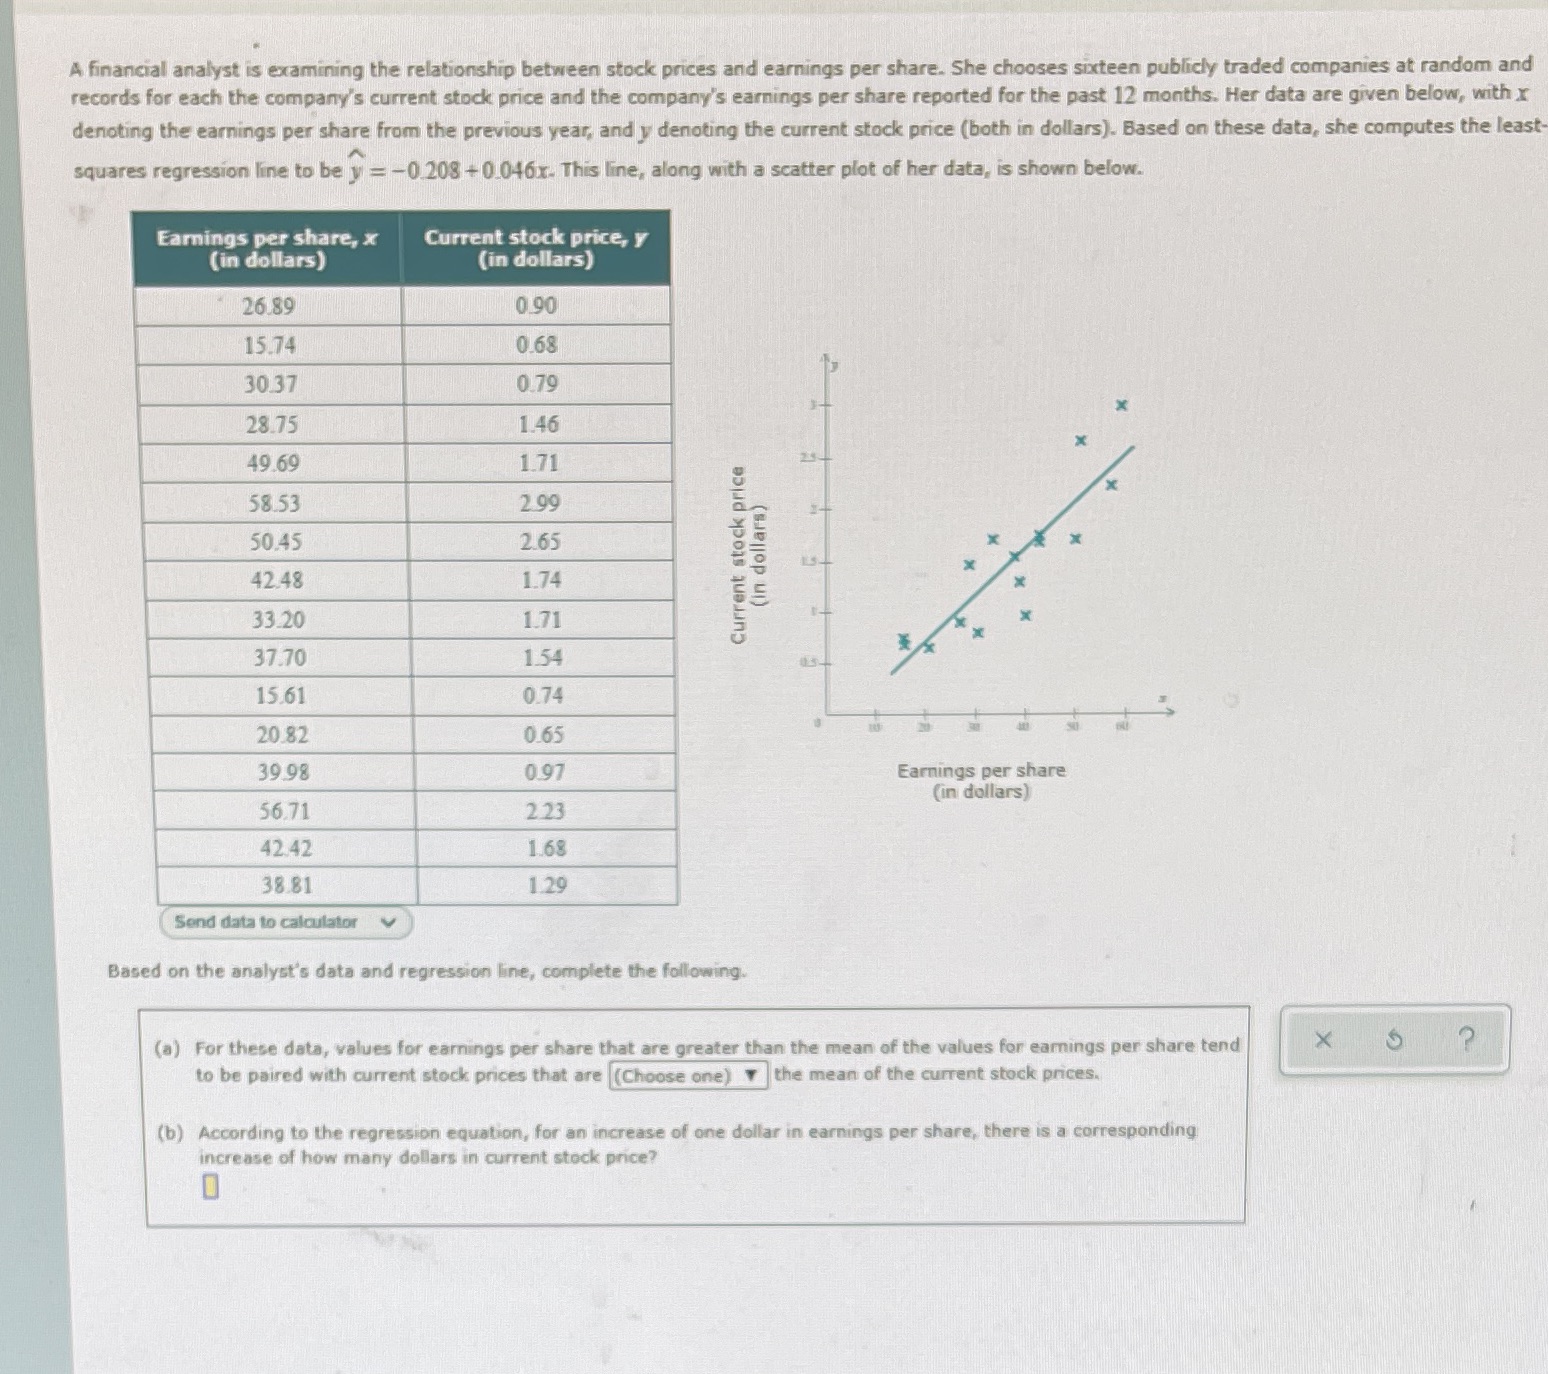
A financial analyst is examining the relationship between stock prices and earnings per share. She chooses sixteen publicly traded companies at random and records for each the company's current stock price and the company's earnings per share reported for the past 12 months. Her data are given below, with x denoting the earnings per share from the previous year, and y denoting the current stock price (both in dollars). Based on these data, she computes the least squares regression line to be y - -0.208 +0.046x- This line, along with a scatter plot of her data, is shown below. Earnings per share, x Current stock price, y (in dollars) (in dollars) 26.89 0.90 15.74 0.68 30.37 0.79 28.75 1.46 49.69 1.71 58.53 2 99 50.45 2.65 (in dollars) Current stock price 42.48 1.74 33.20 1.71 37.70 1.54 15.61 0.74 20.82 0.65 39.98 0.97 Earnings per share (in dollars) 56.71 2 23 42.42 1.68 38 81 1.29 Send data to calculator Based on the analyst's data and regression line, complete the following. (a) For these data, values for earnings per share that are greater than the mean of the values for earnings per share tend X ? to be paired with current stock prices that are |(Choose one) Y |the mean of the current stock prices. (b) According to the regression equation, for an increase of one dollar in earnings per share, there is a corresponding increase of how many dollars in current stock price
Step by Step Solution
There are 3 Steps involved in it

Get step-by-step solutions from verified subject matter experts