

Question: (a): Your answer is incorrect. A financial analyst is examining the relationship between stock prices and earnings per share. She chooses 45 publicly traded companies
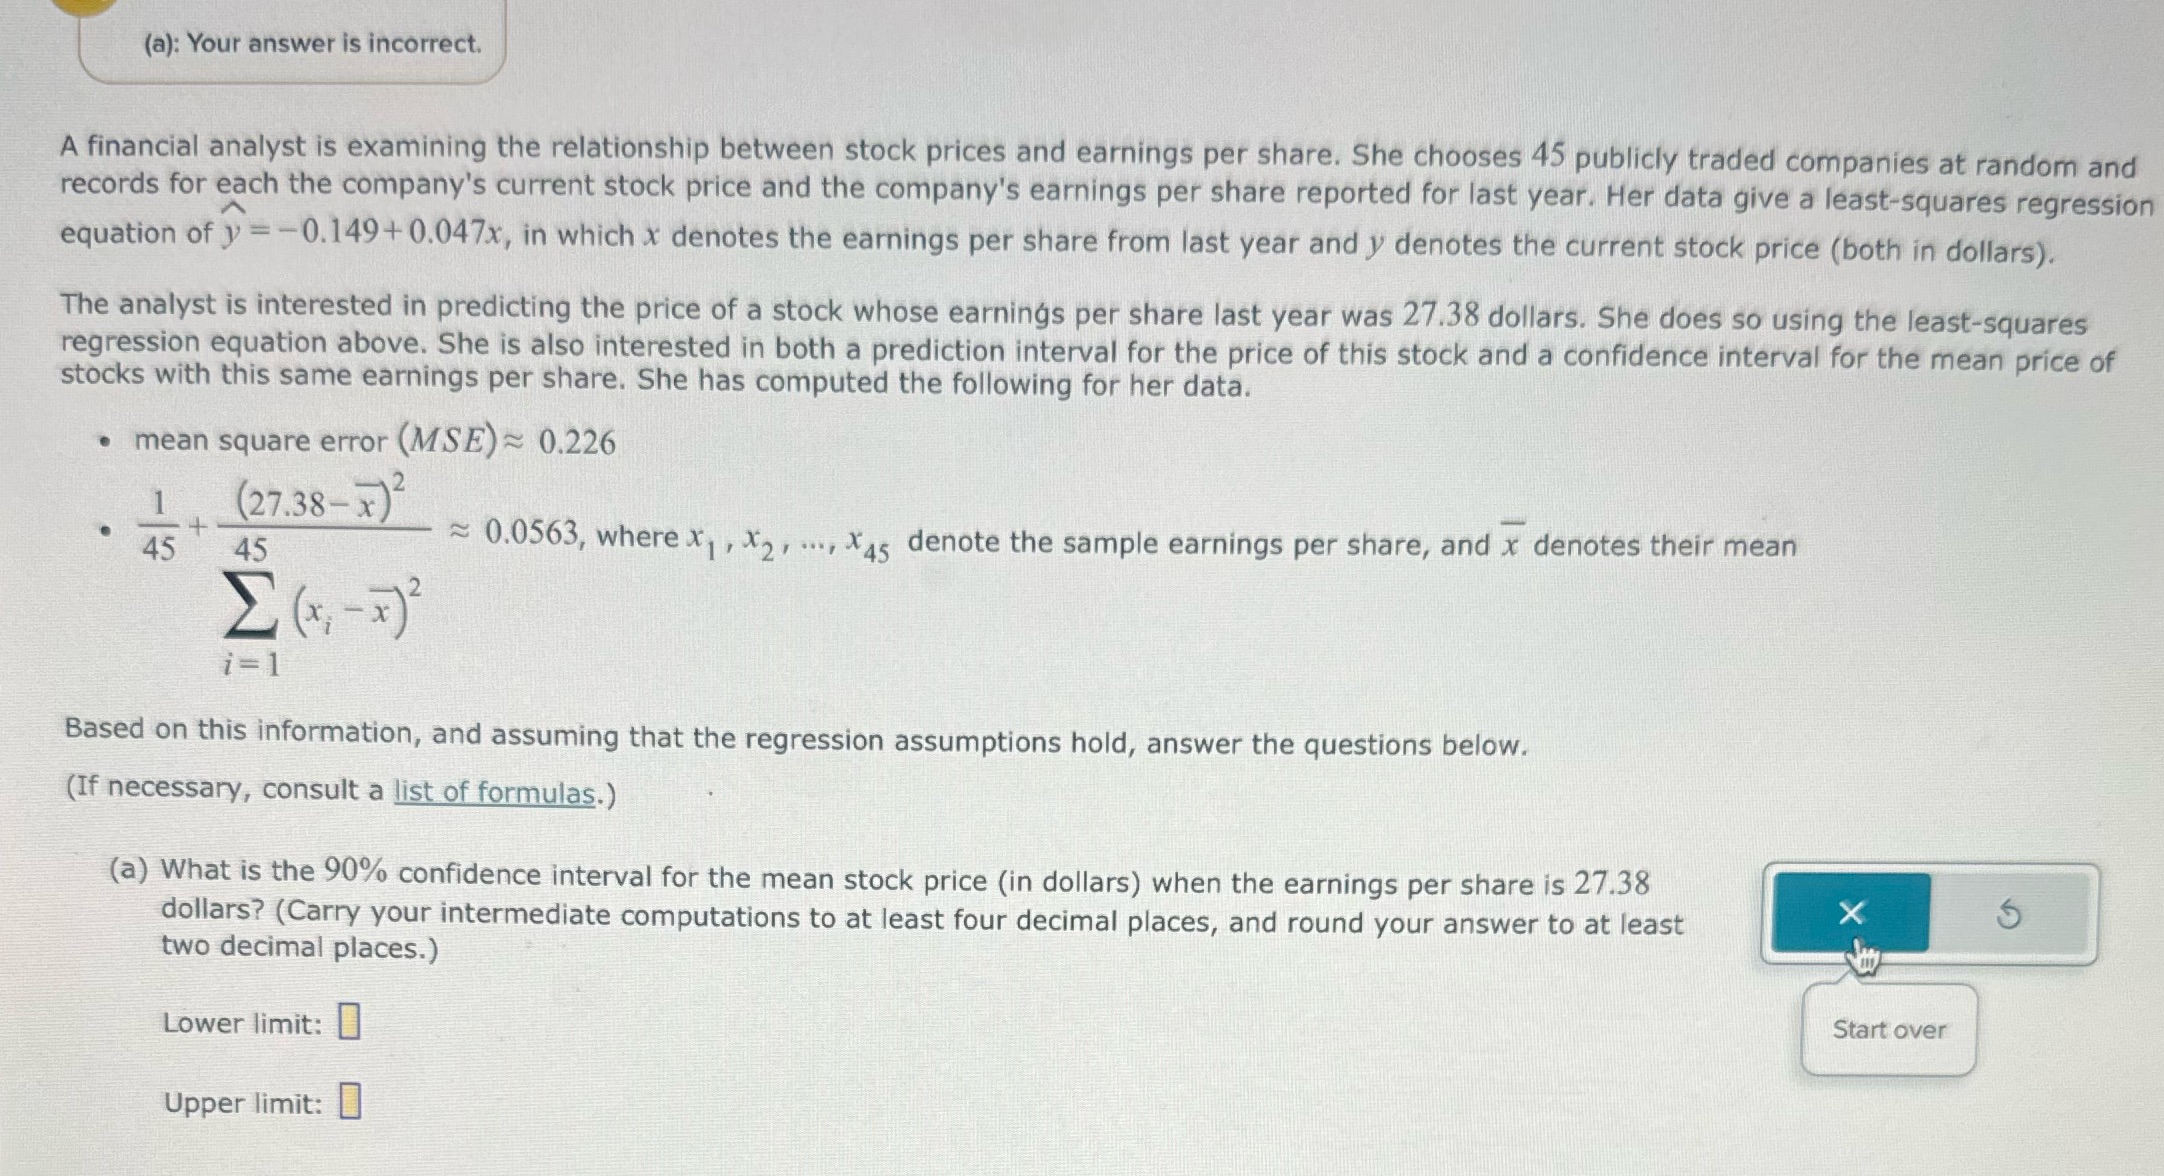
(a): Your answer is incorrect. A financial analyst is examining the relationship between stock prices and earnings per share. She chooses 45 publicly traded companies at random and records for each the company's current stock price and the company's earnings per share reported for last year. Her data give a least-squares regression equation of y = -0.149+0.047x, in which x denotes the earnings per share from last year and y denotes the current stock price (both in dollars). The analyst is interested in predicting the price of a stock whose earnings per share last year was 27.38 dollars. She does so using the least-squares regression equation above. She is also interested in both a prediction interval for the price of this stock and a confidence interval for the mean price of stocks with this same earnings per share. She has computed the following for her data. . mean square error (MSE) ~ 0.226 (27.38- x)2 45 45 ~ 0.0563, where X] , X2 , ..., X45 denote the sample earnings per share, and x denotes their mean E ( x, - x ) i= Based on this information, and assuming that the regression assumptions hold, answer the questions below. (If necessary, consult a list of formulas.) (a) What is the 90% confidence interval for the mean stock price (in dollars) when the earnings per share is 27.38 dollars? (Carry your intermediate computations to at least four decimal places, and round your answer to at least X two decimal places.) Lower limit: Start over Upper limit
Step by Step Solution
There are 3 Steps involved in it

Get step-by-step solutions from verified subject matter experts